Cisco Systems
Nexus Dashboard
UX/UI
Enterprise
SaaS
B2B
Overview
Role
Tools
Duration
Product revamp
Brainstorm new design principles
😊 Friendly and human tone
📐 Consistency and scalability
💡 Design with intention and intuition
⚖️ Accessible and inclusive
Adopt a new design system
Overview of revamped features
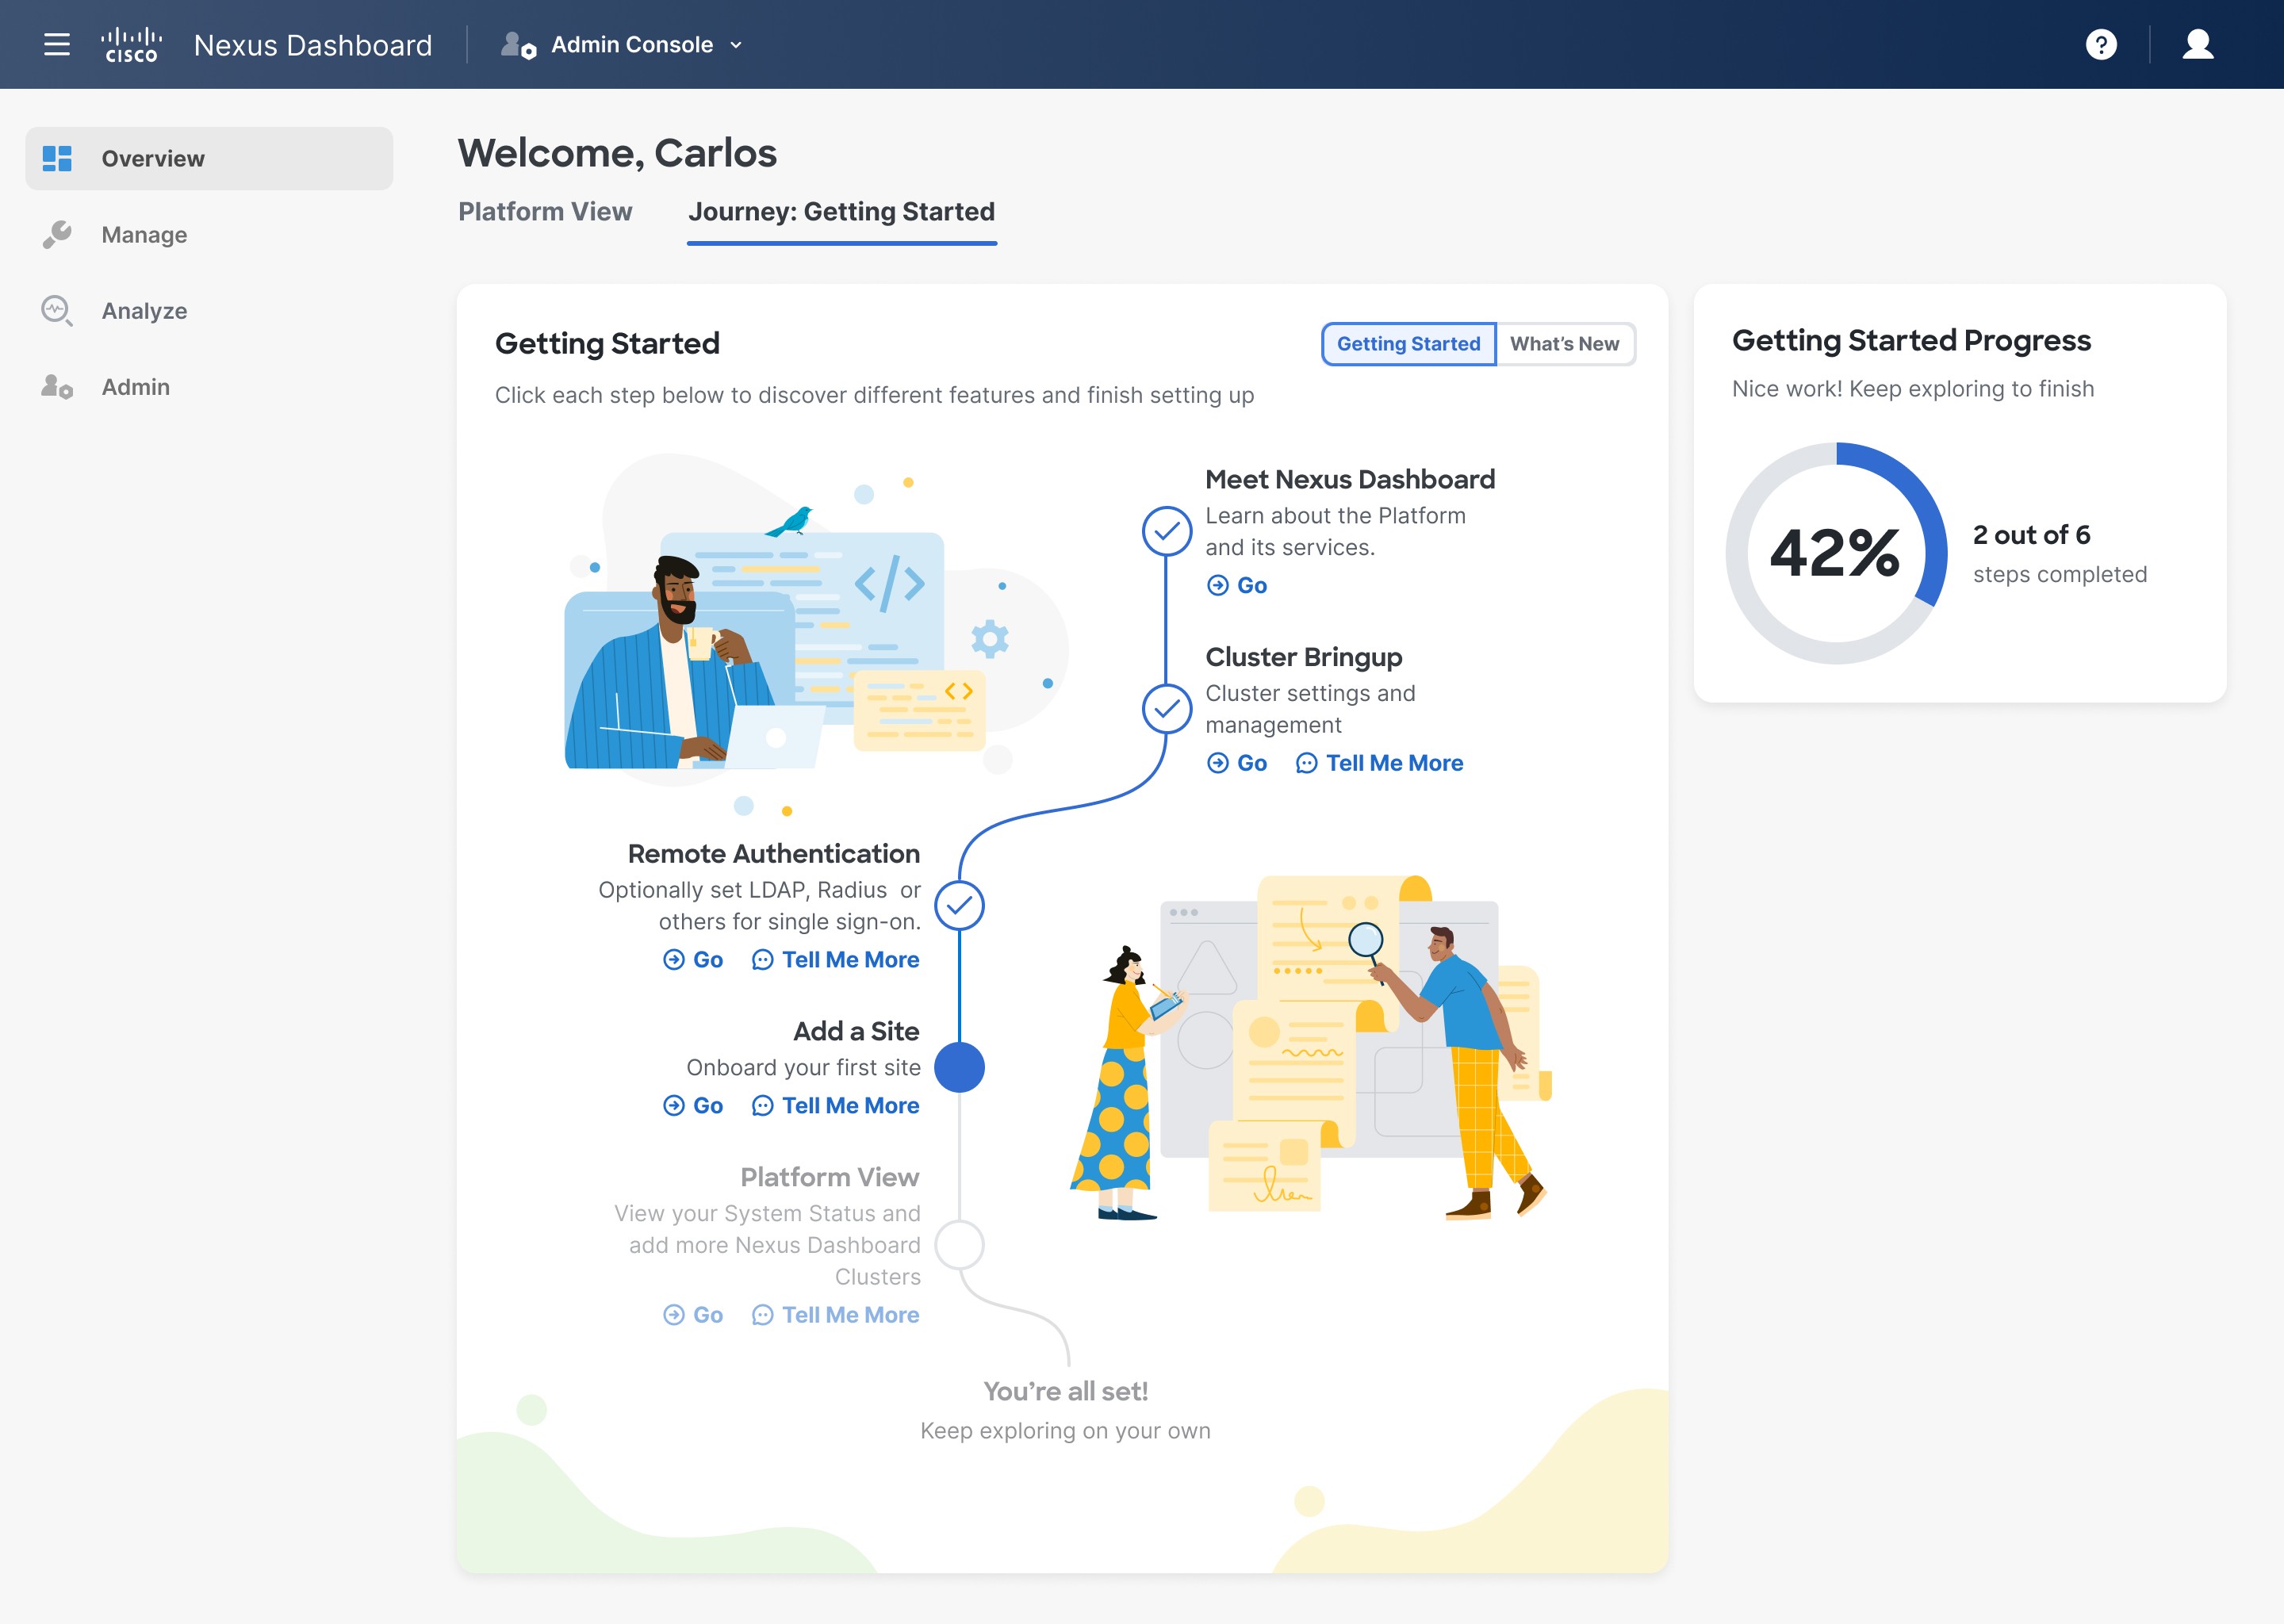
Onboarding journey
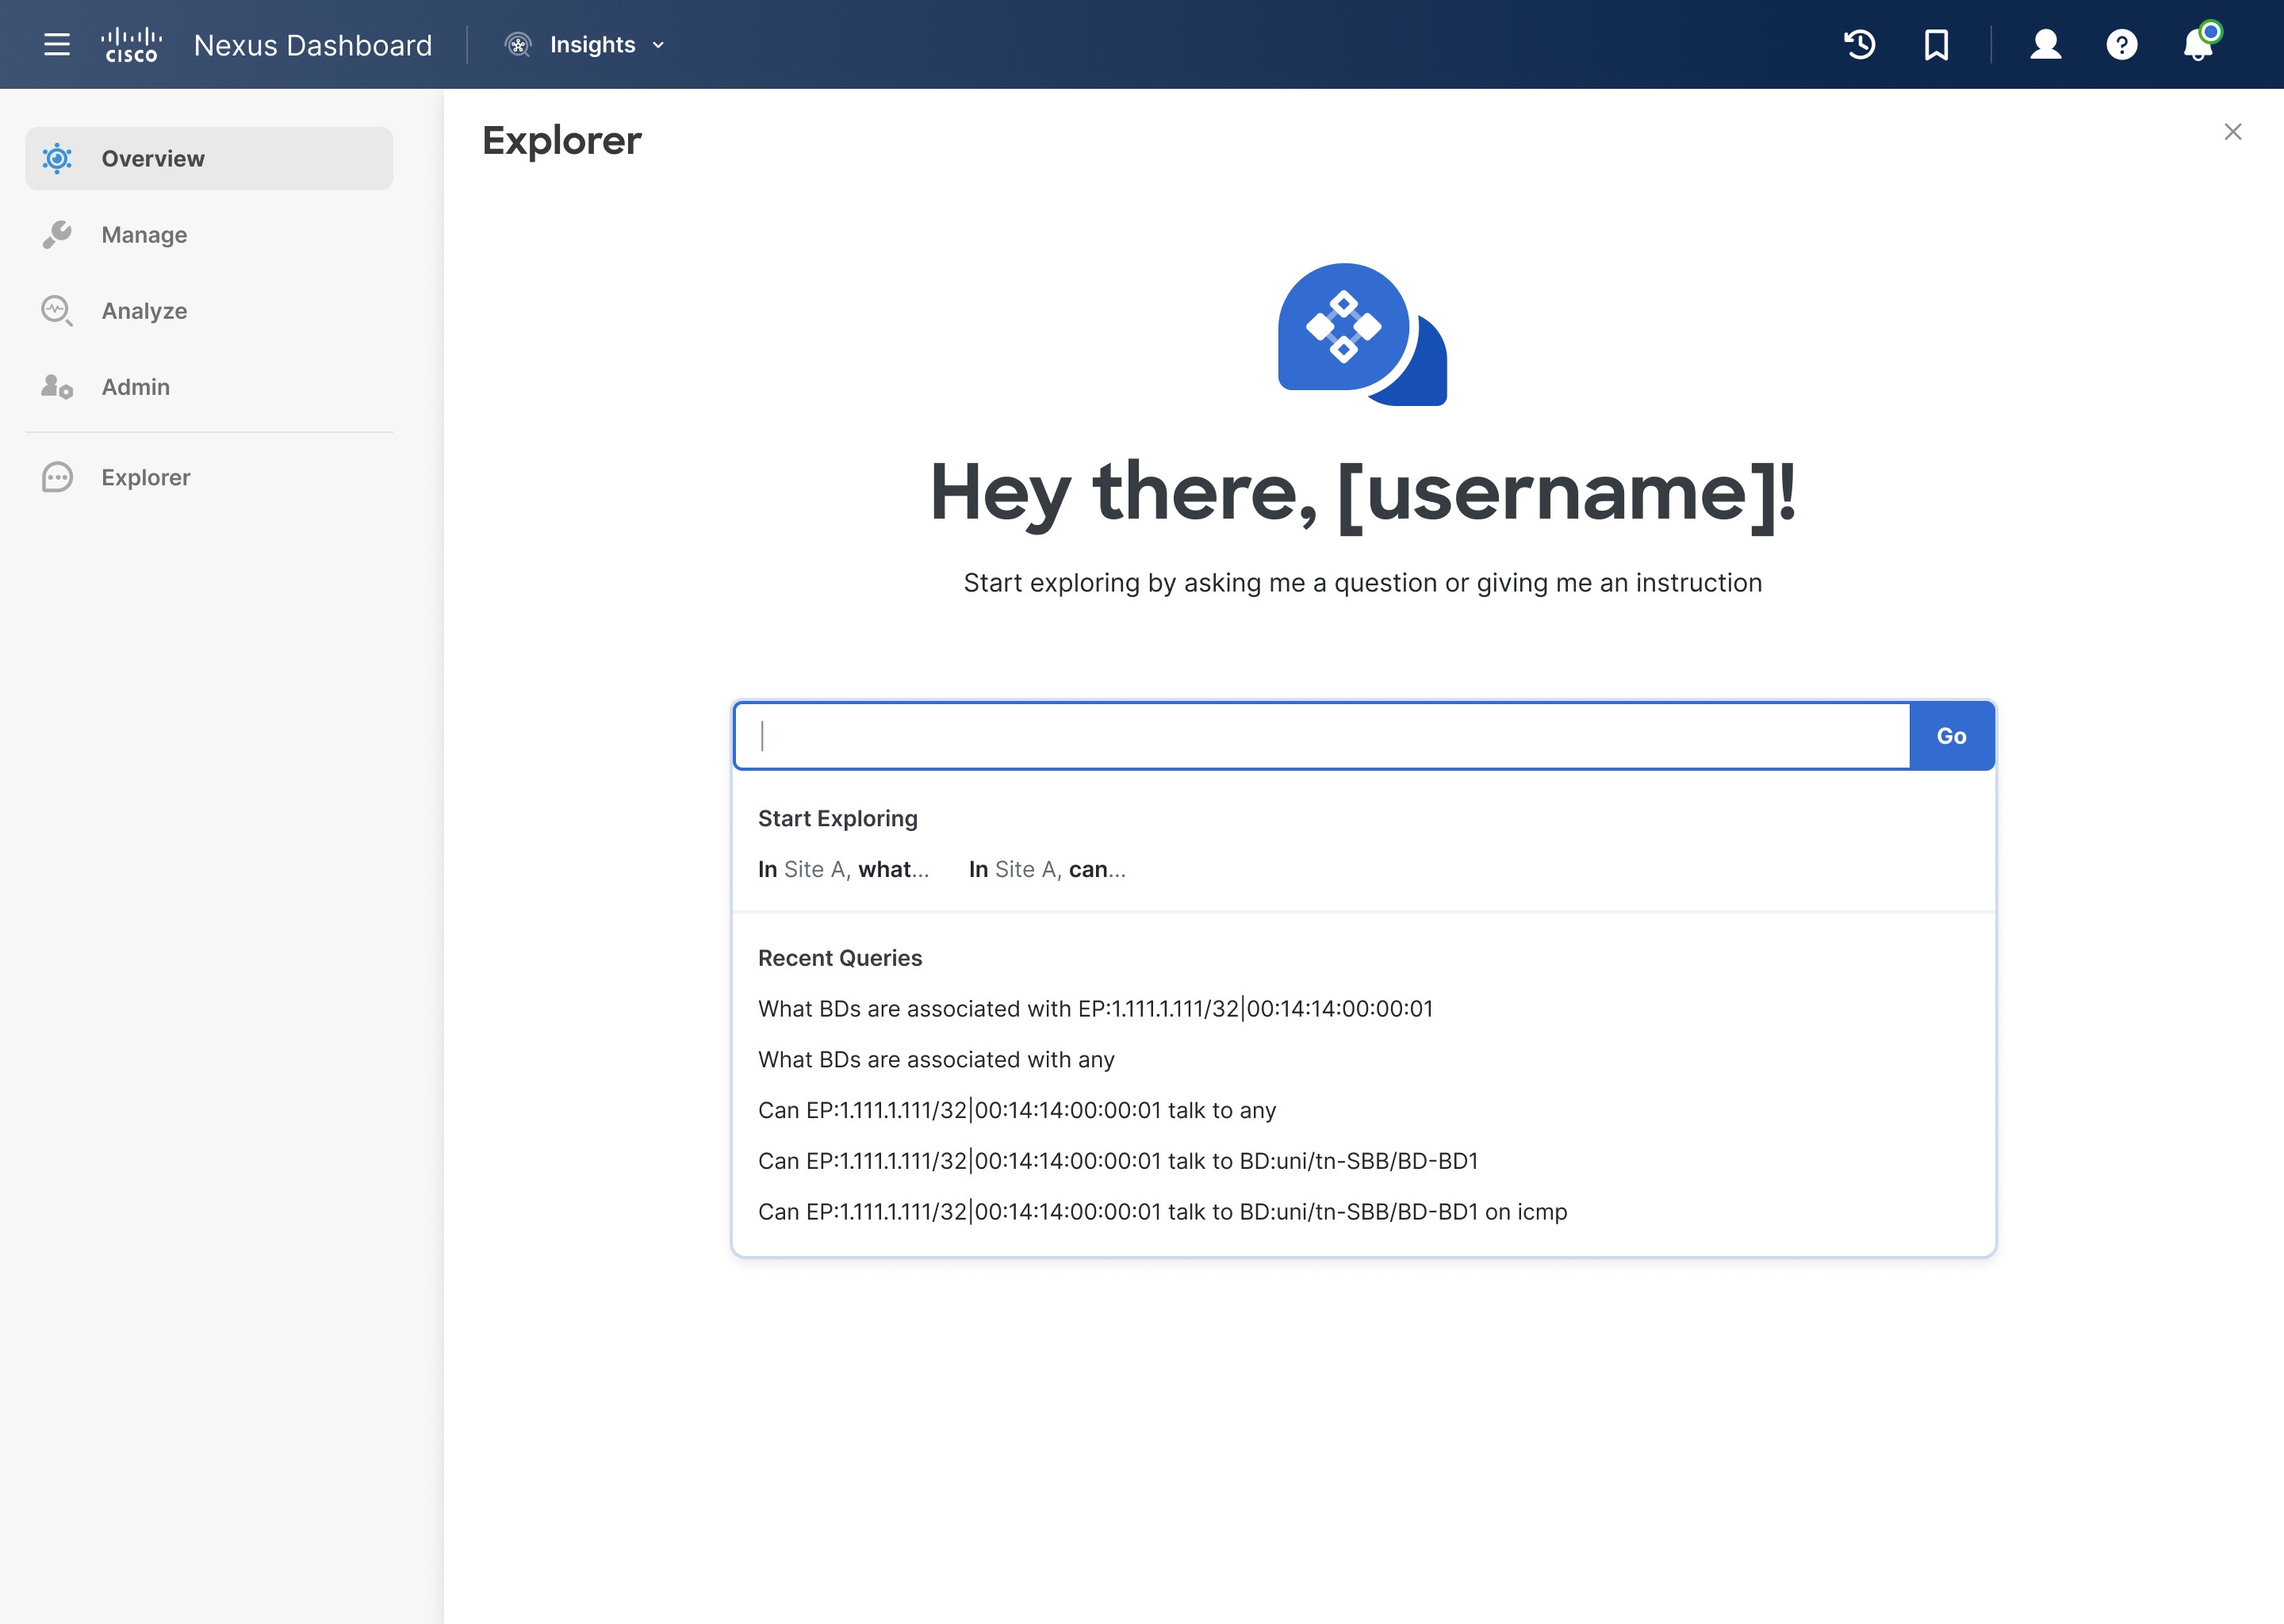
Explorer

Custom dashboards
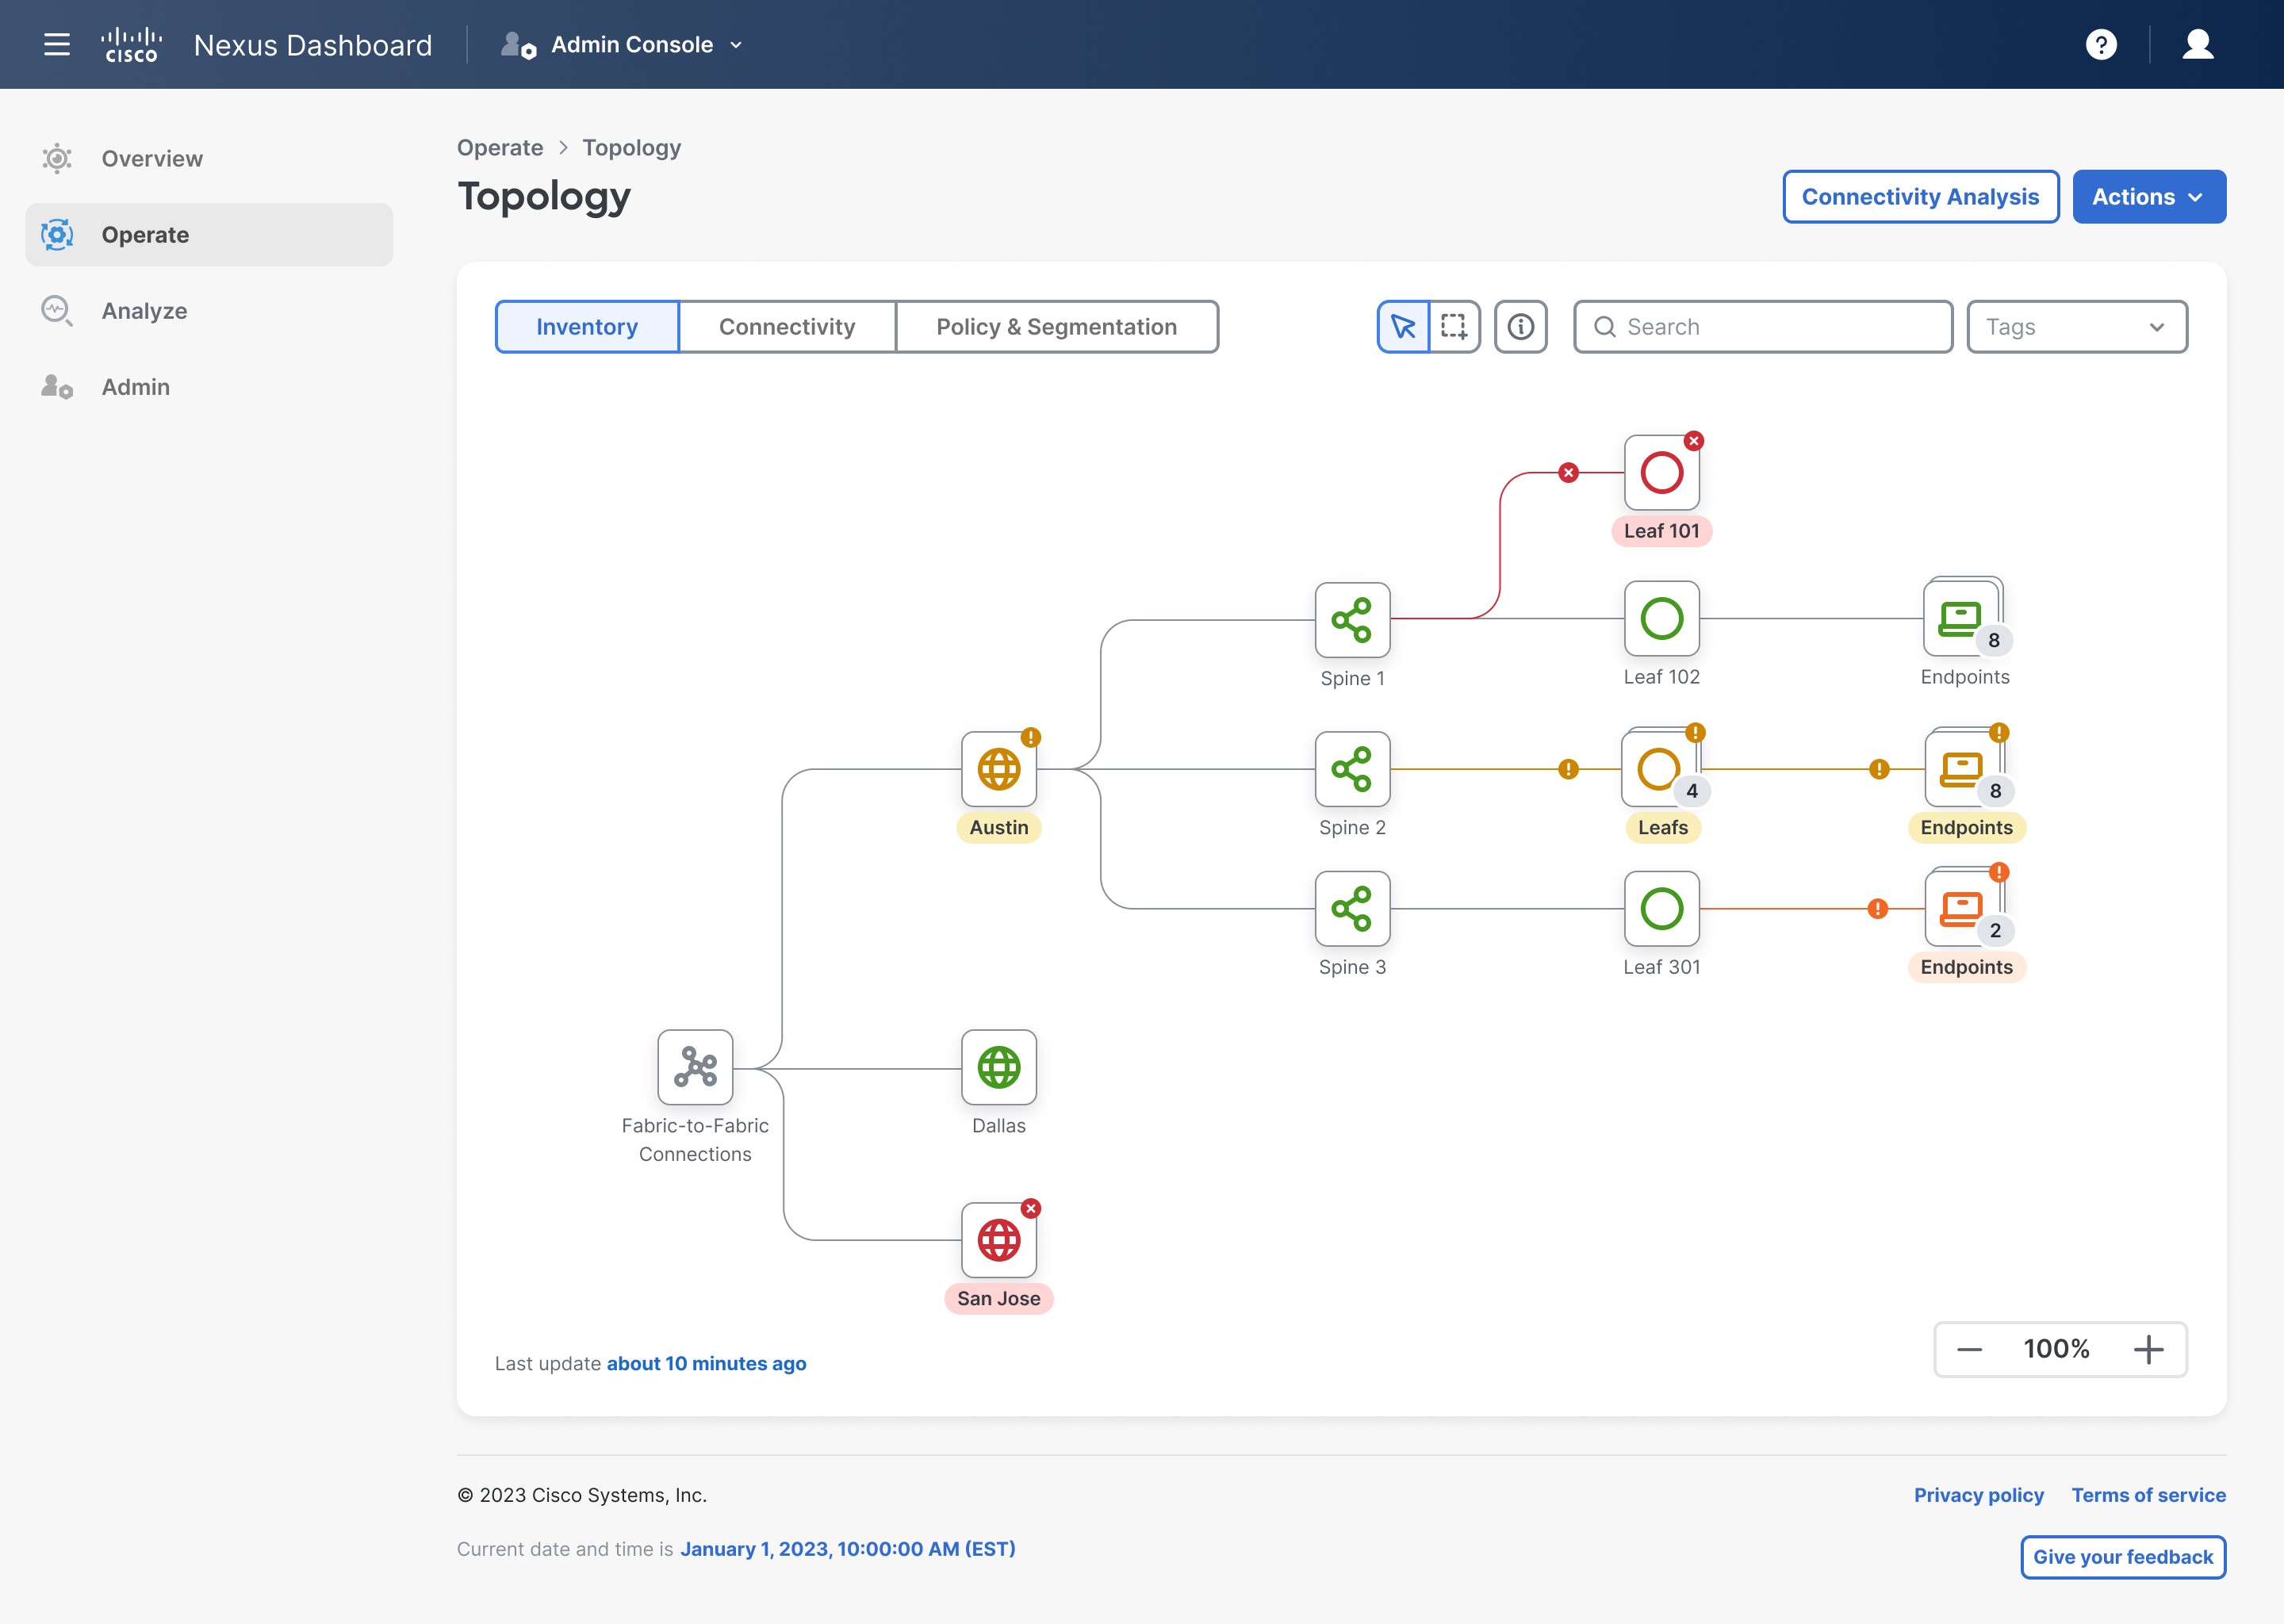
Toplogy
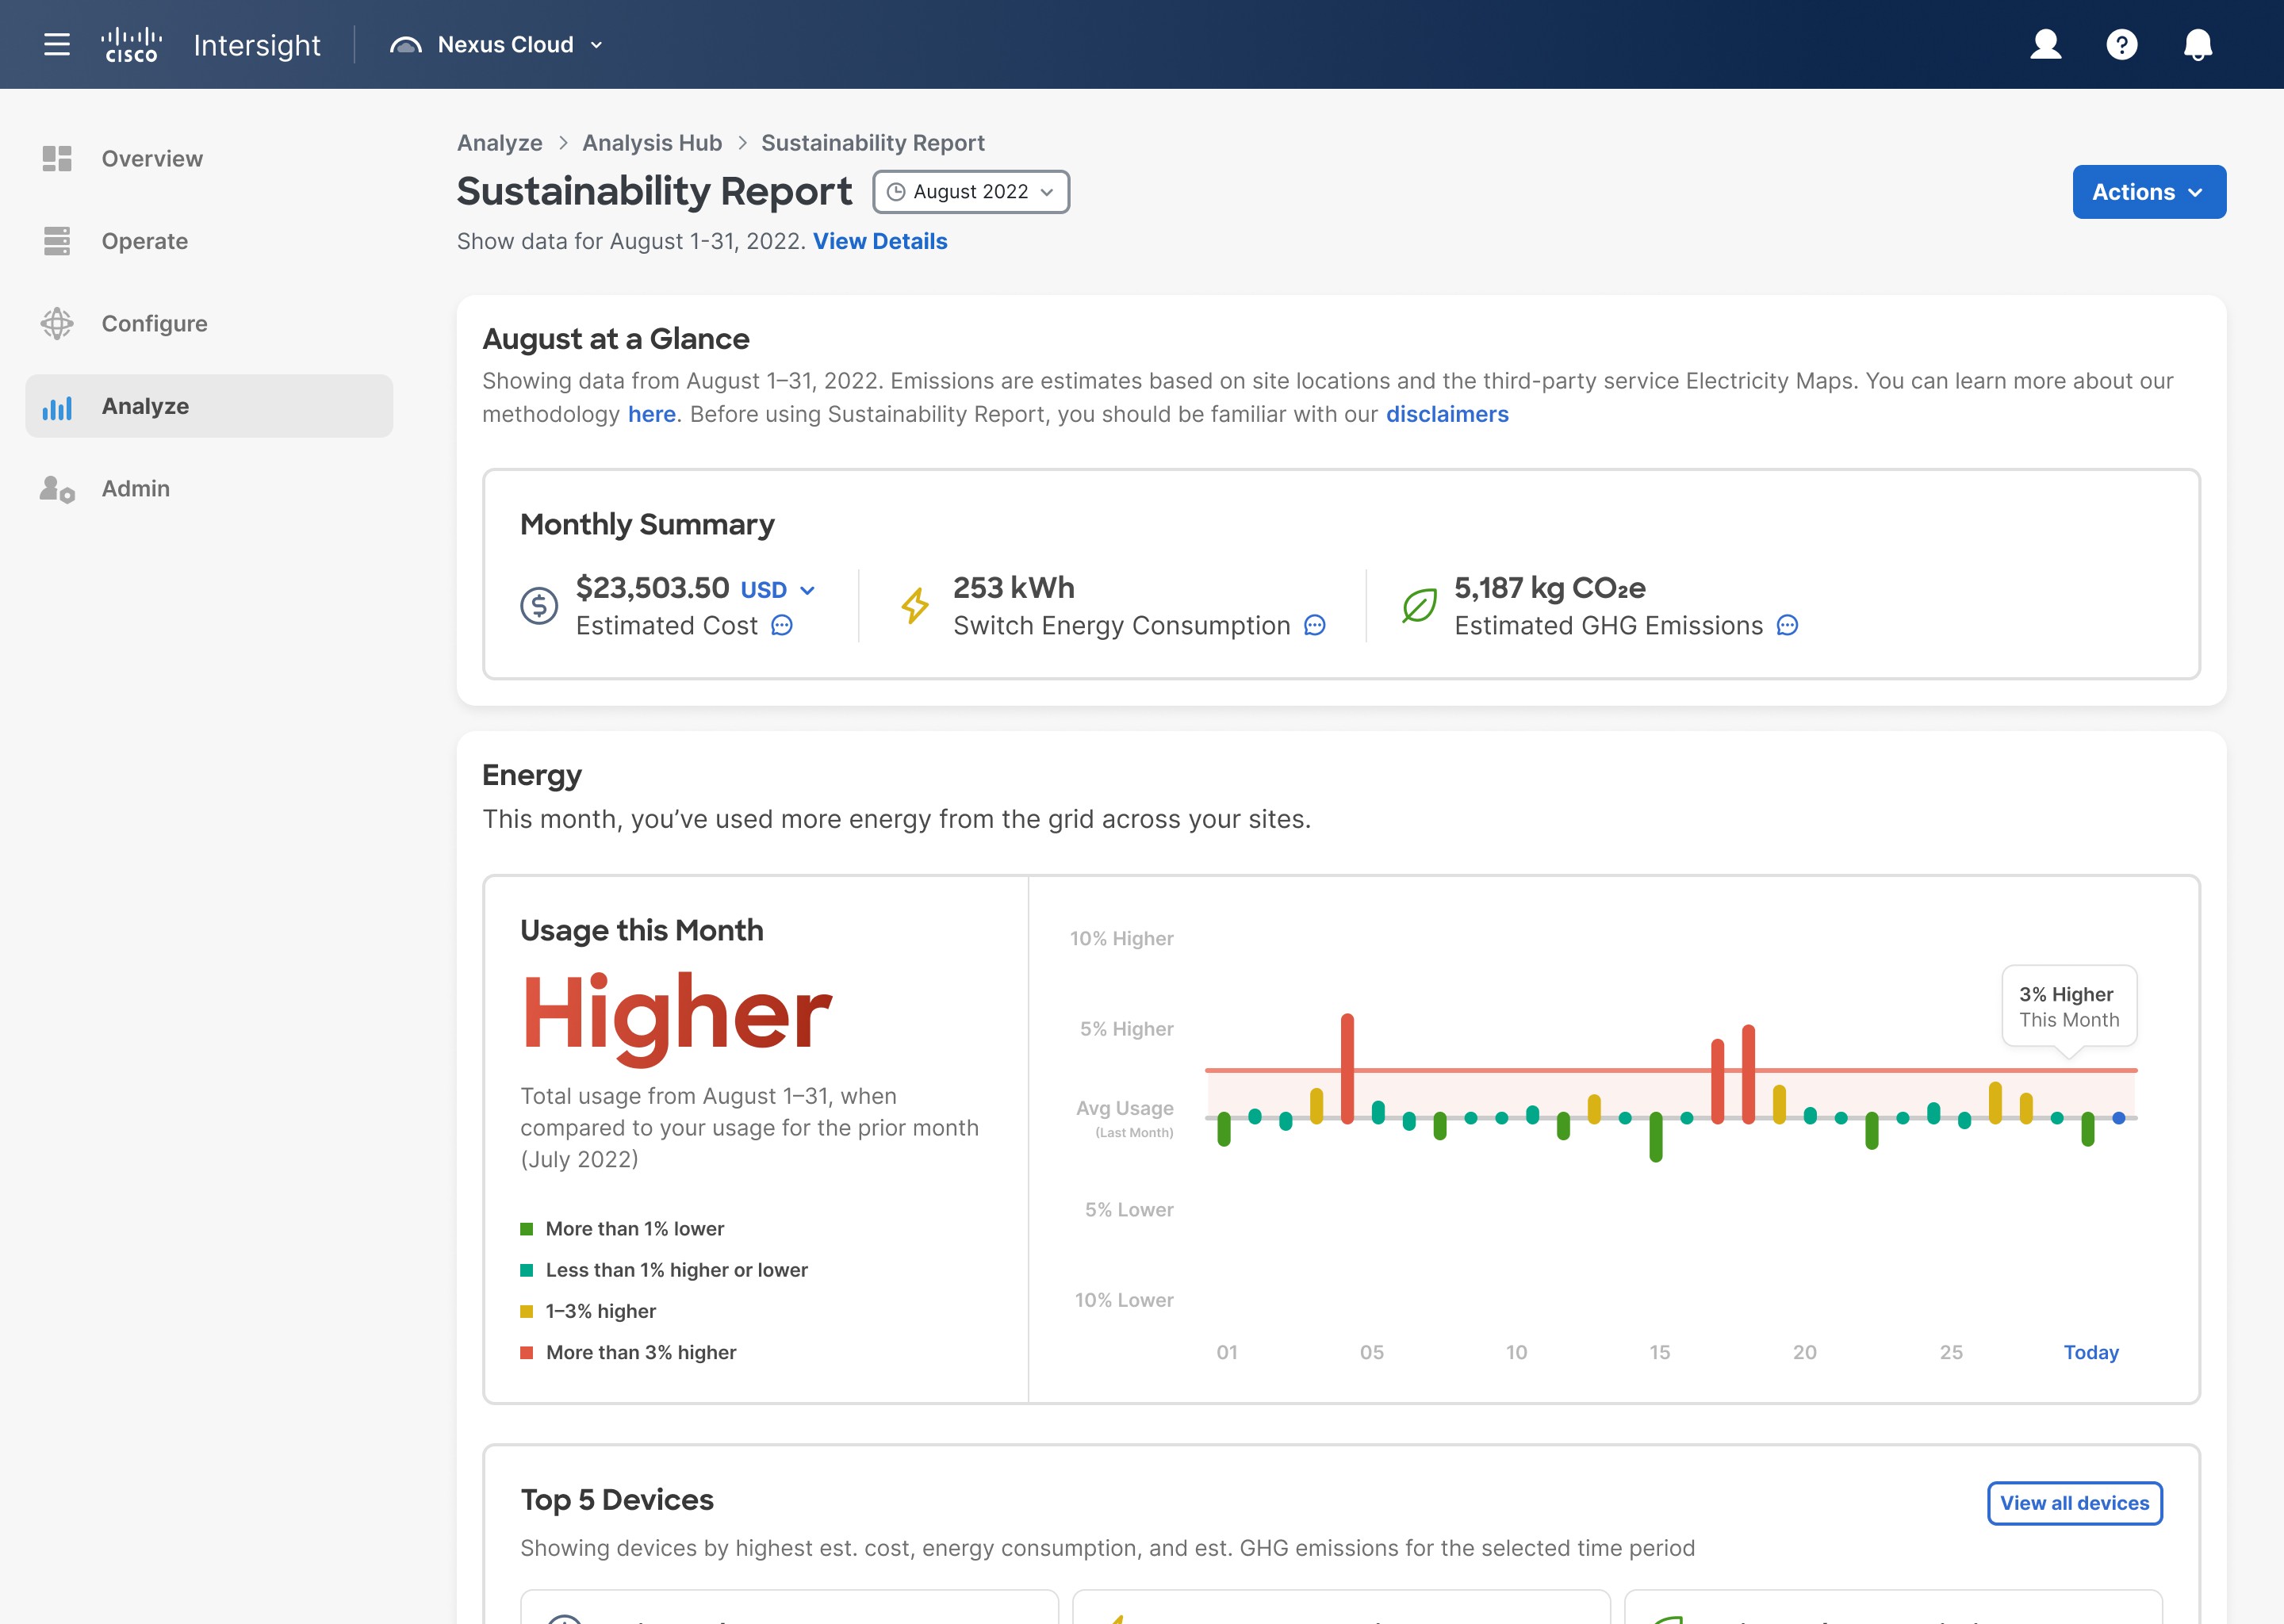
Sustainability

Alerts and rules
Feature Deep Dive
Analyze anomalies
User goals 👩💻
Quick anomaly remediation
Tools for team collaboration and organization
Business needs 💸
Maximize user productivity
Healthy hardware and software for maximum performance
Solution 🚀
Step-by-step remediation guide
Tagging and commenting with team members
User flow
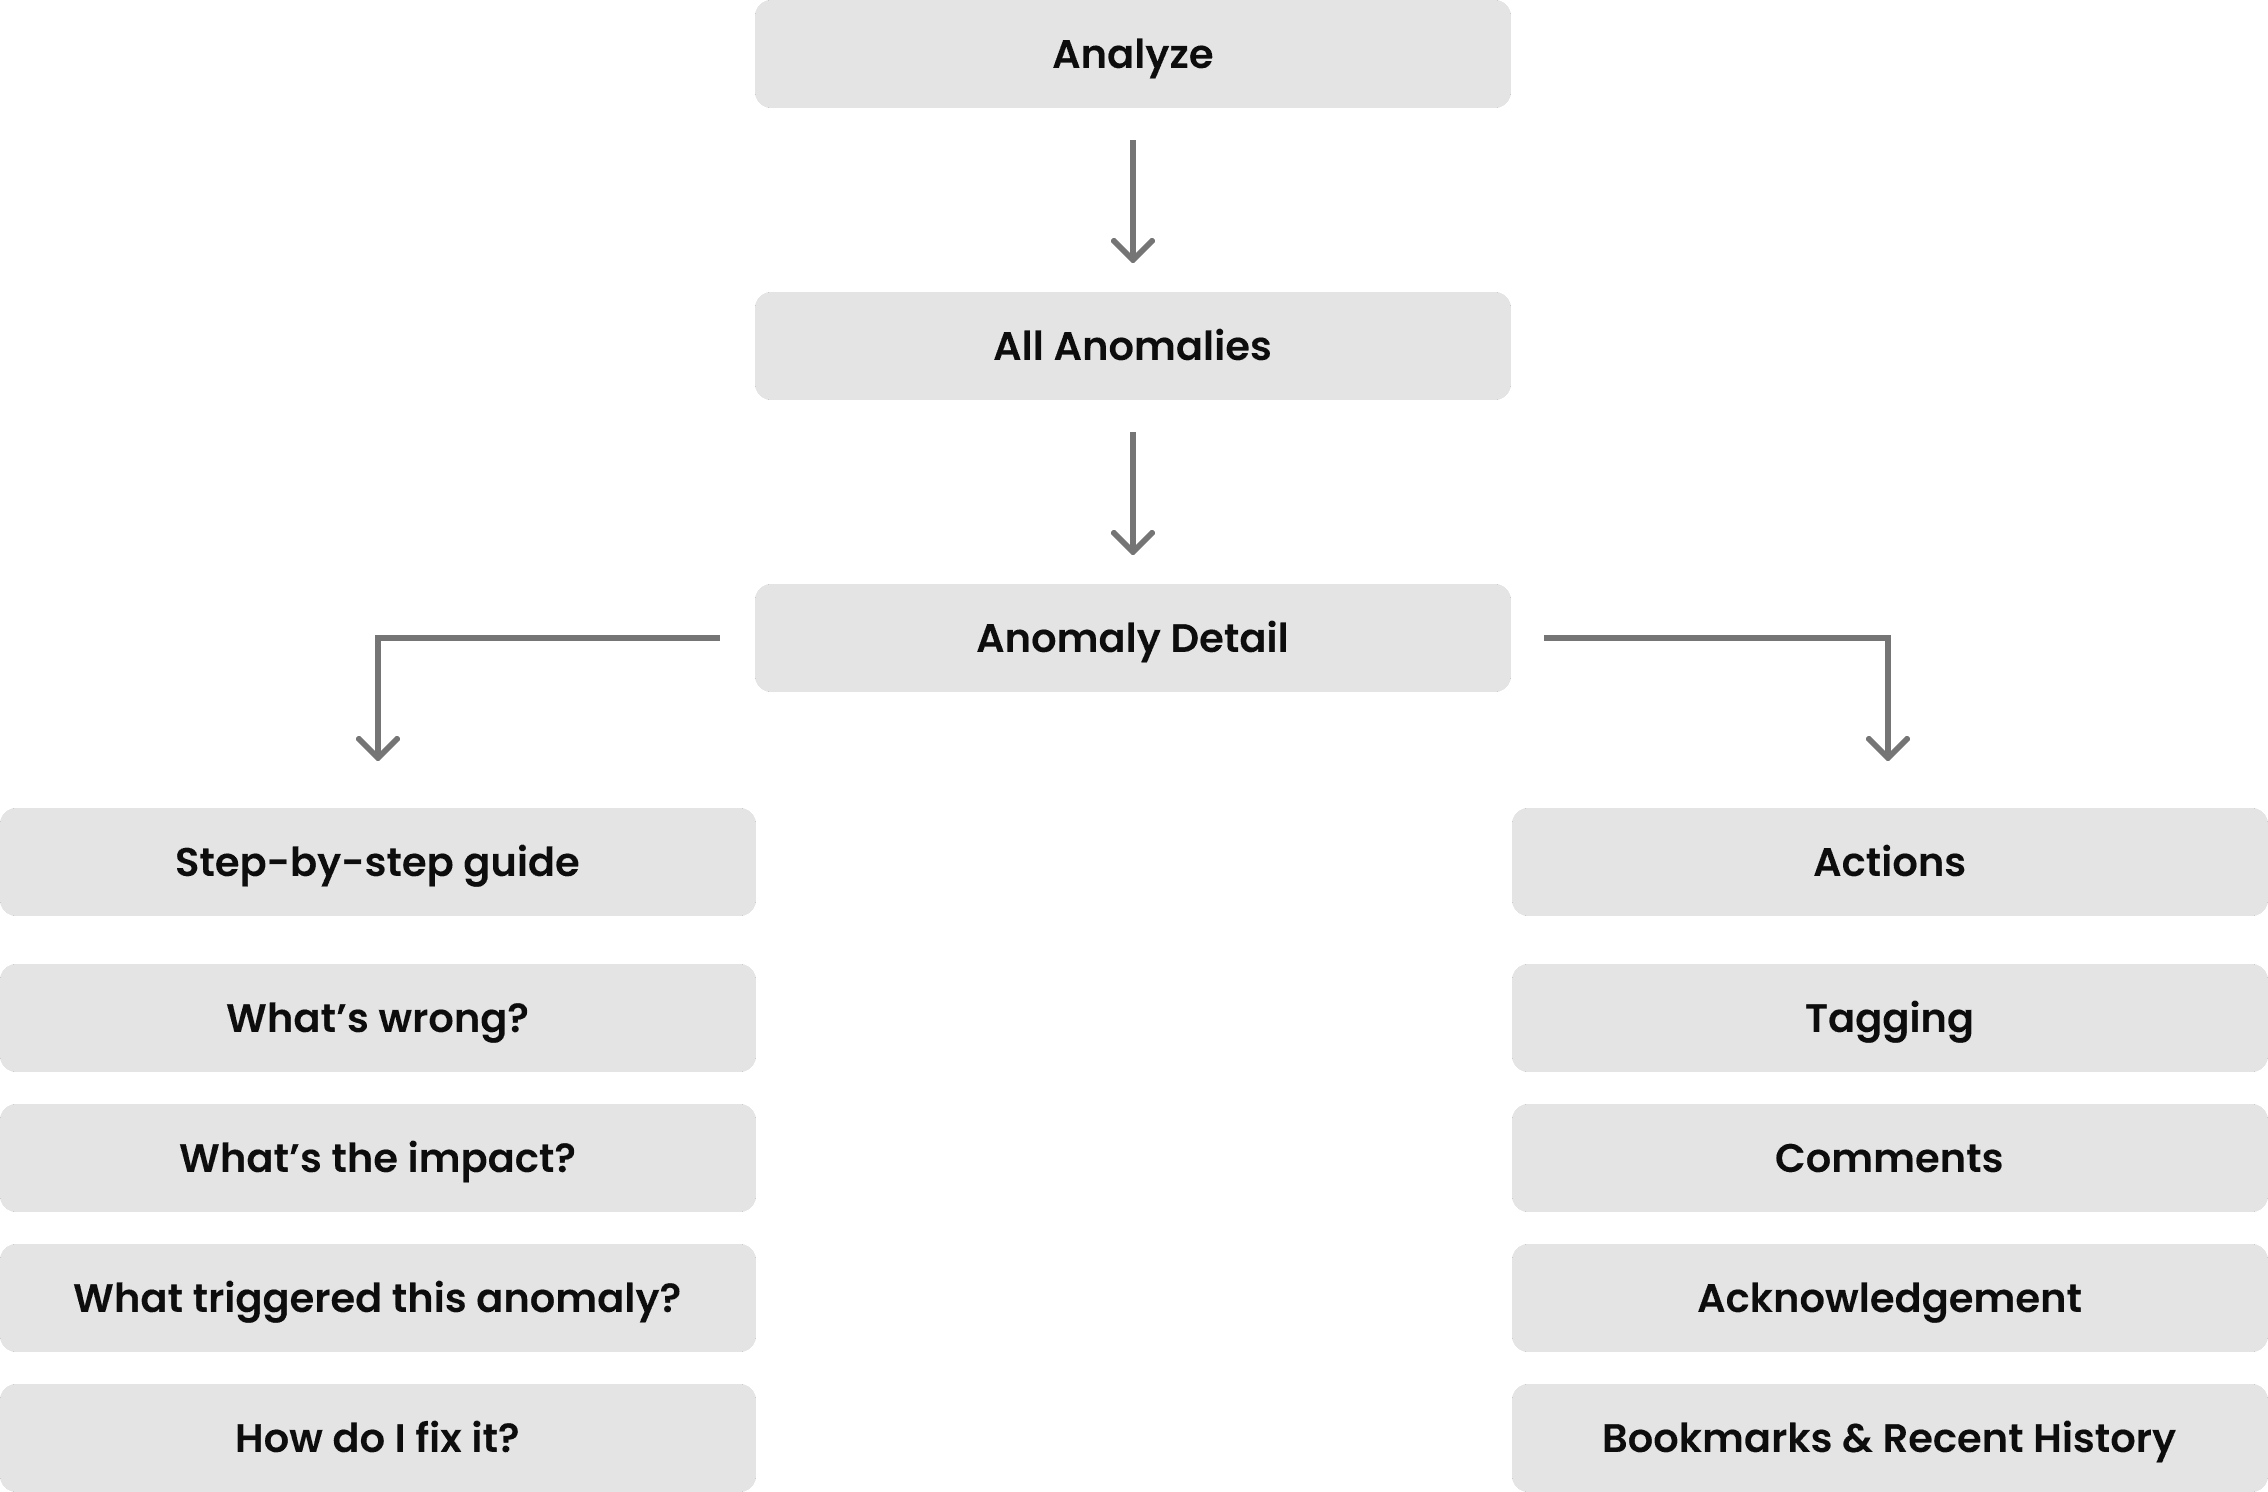
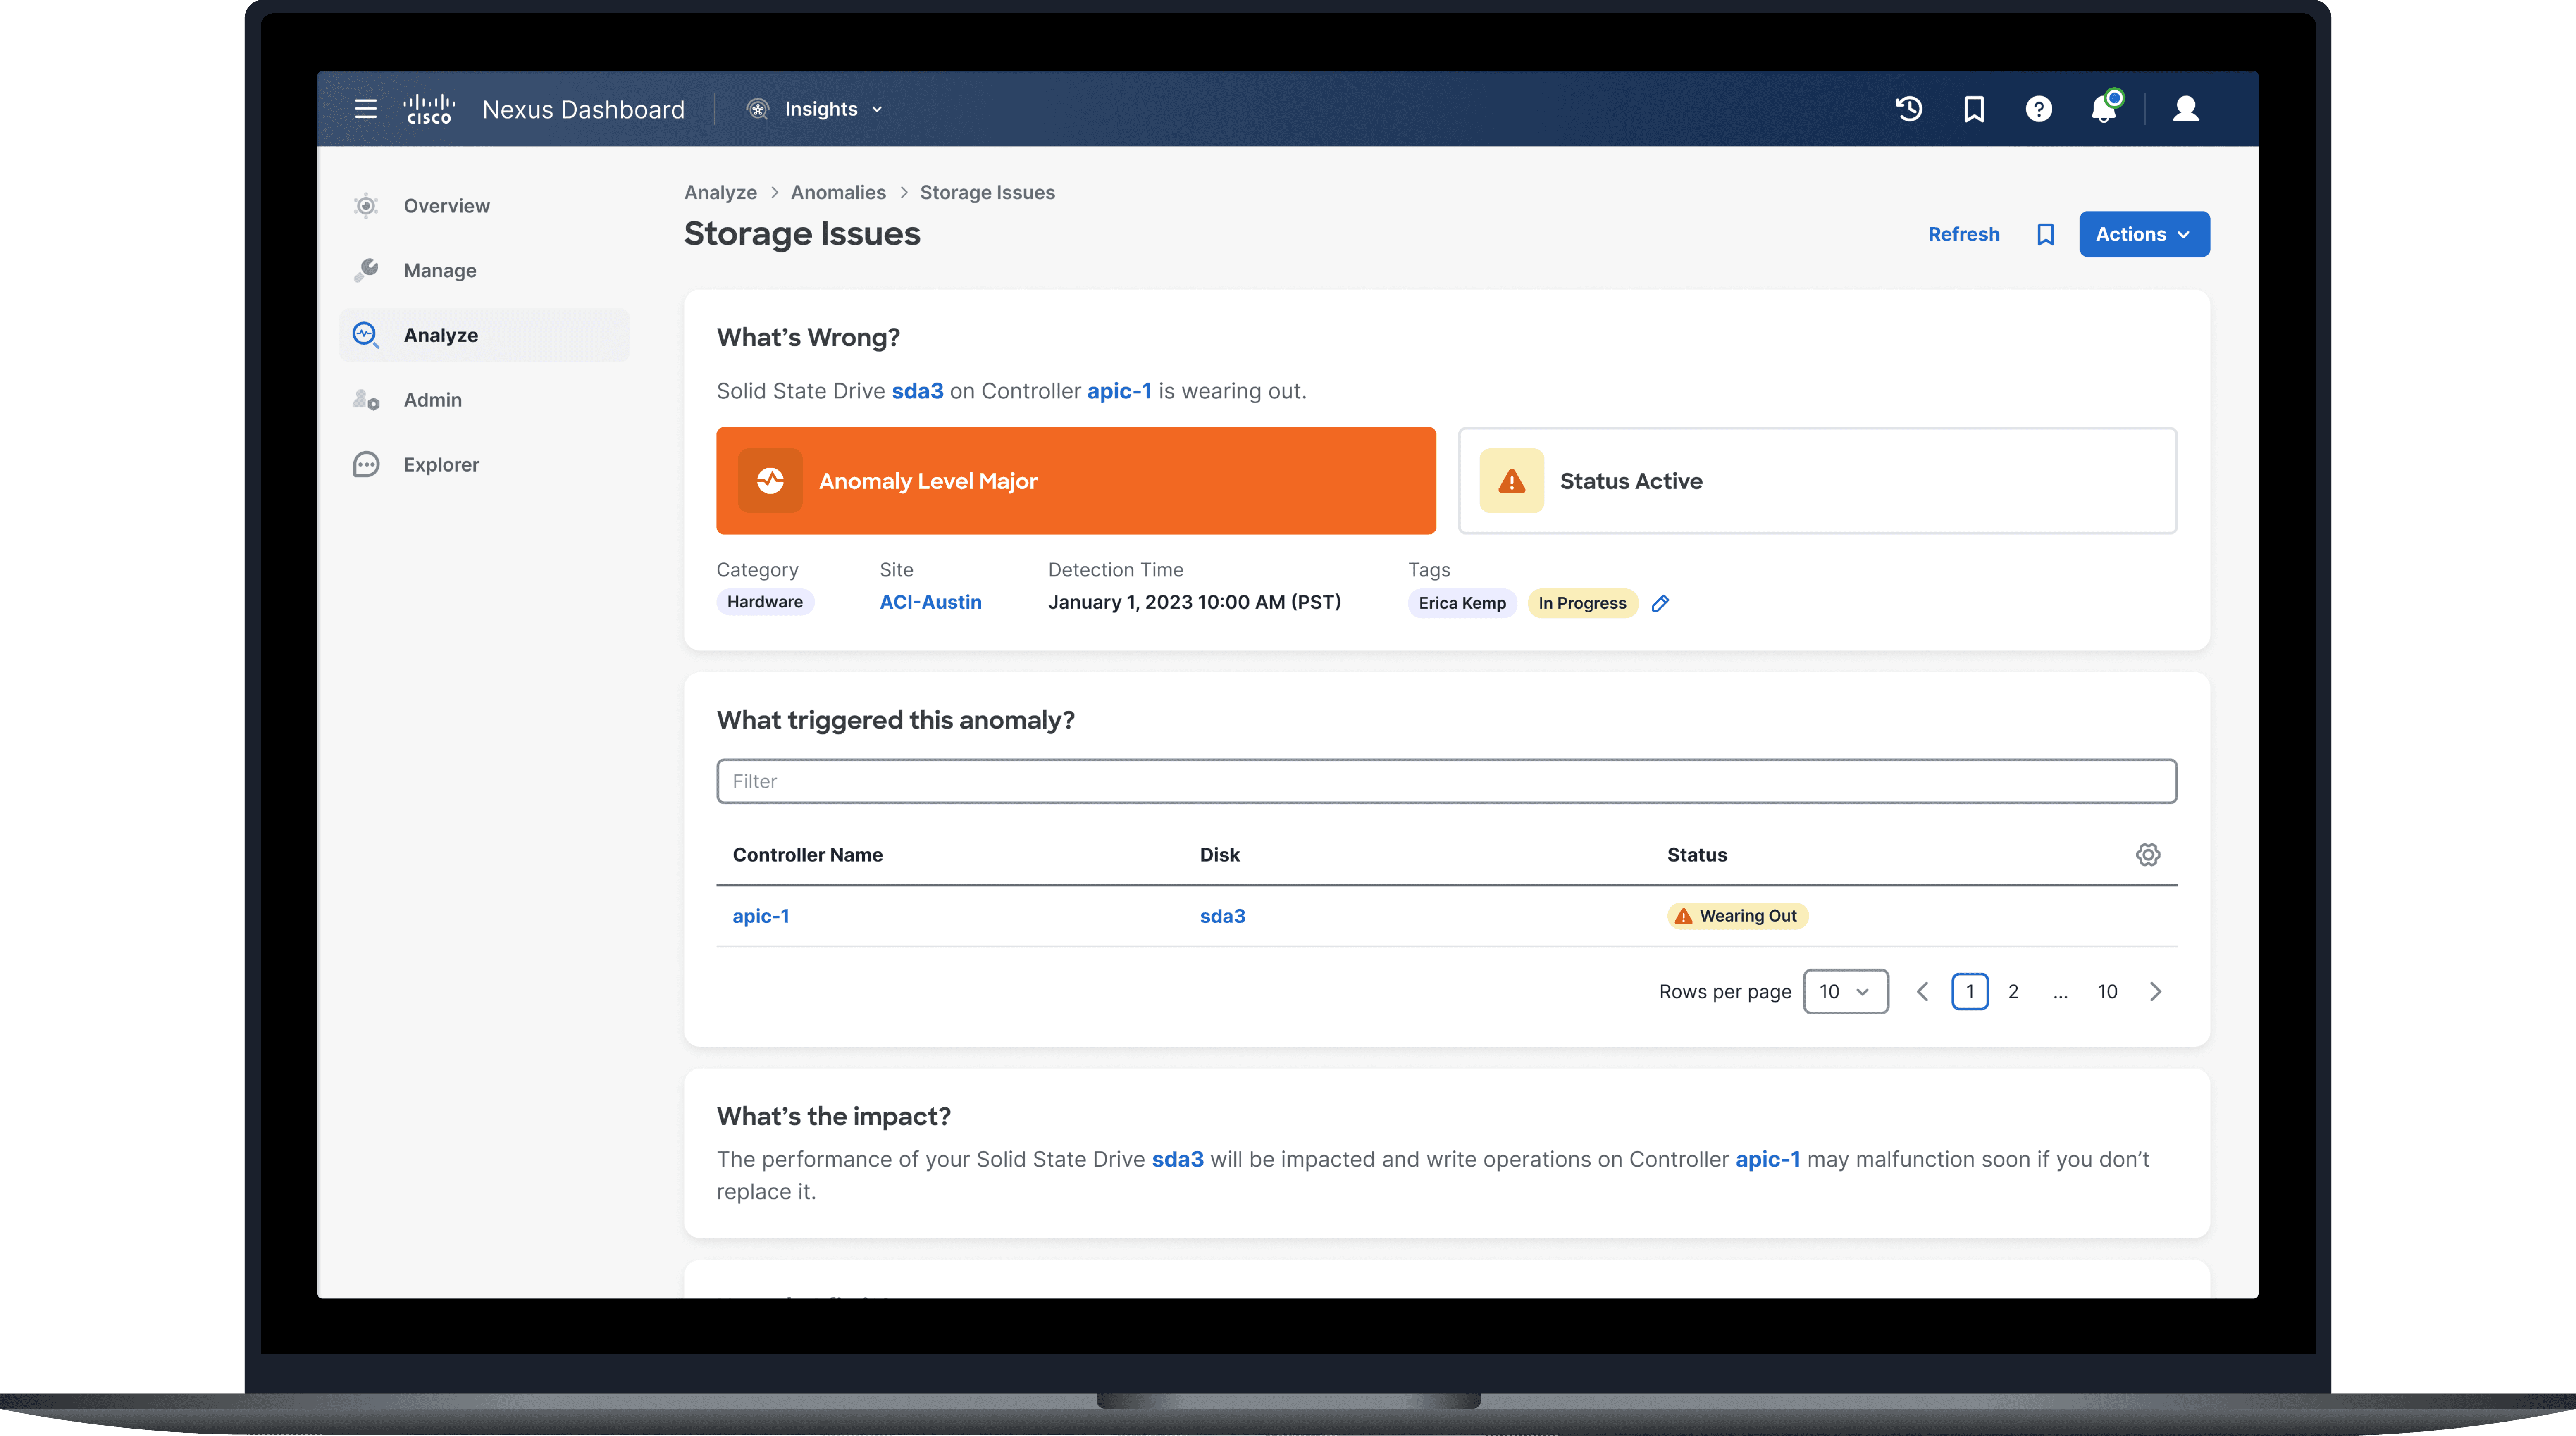
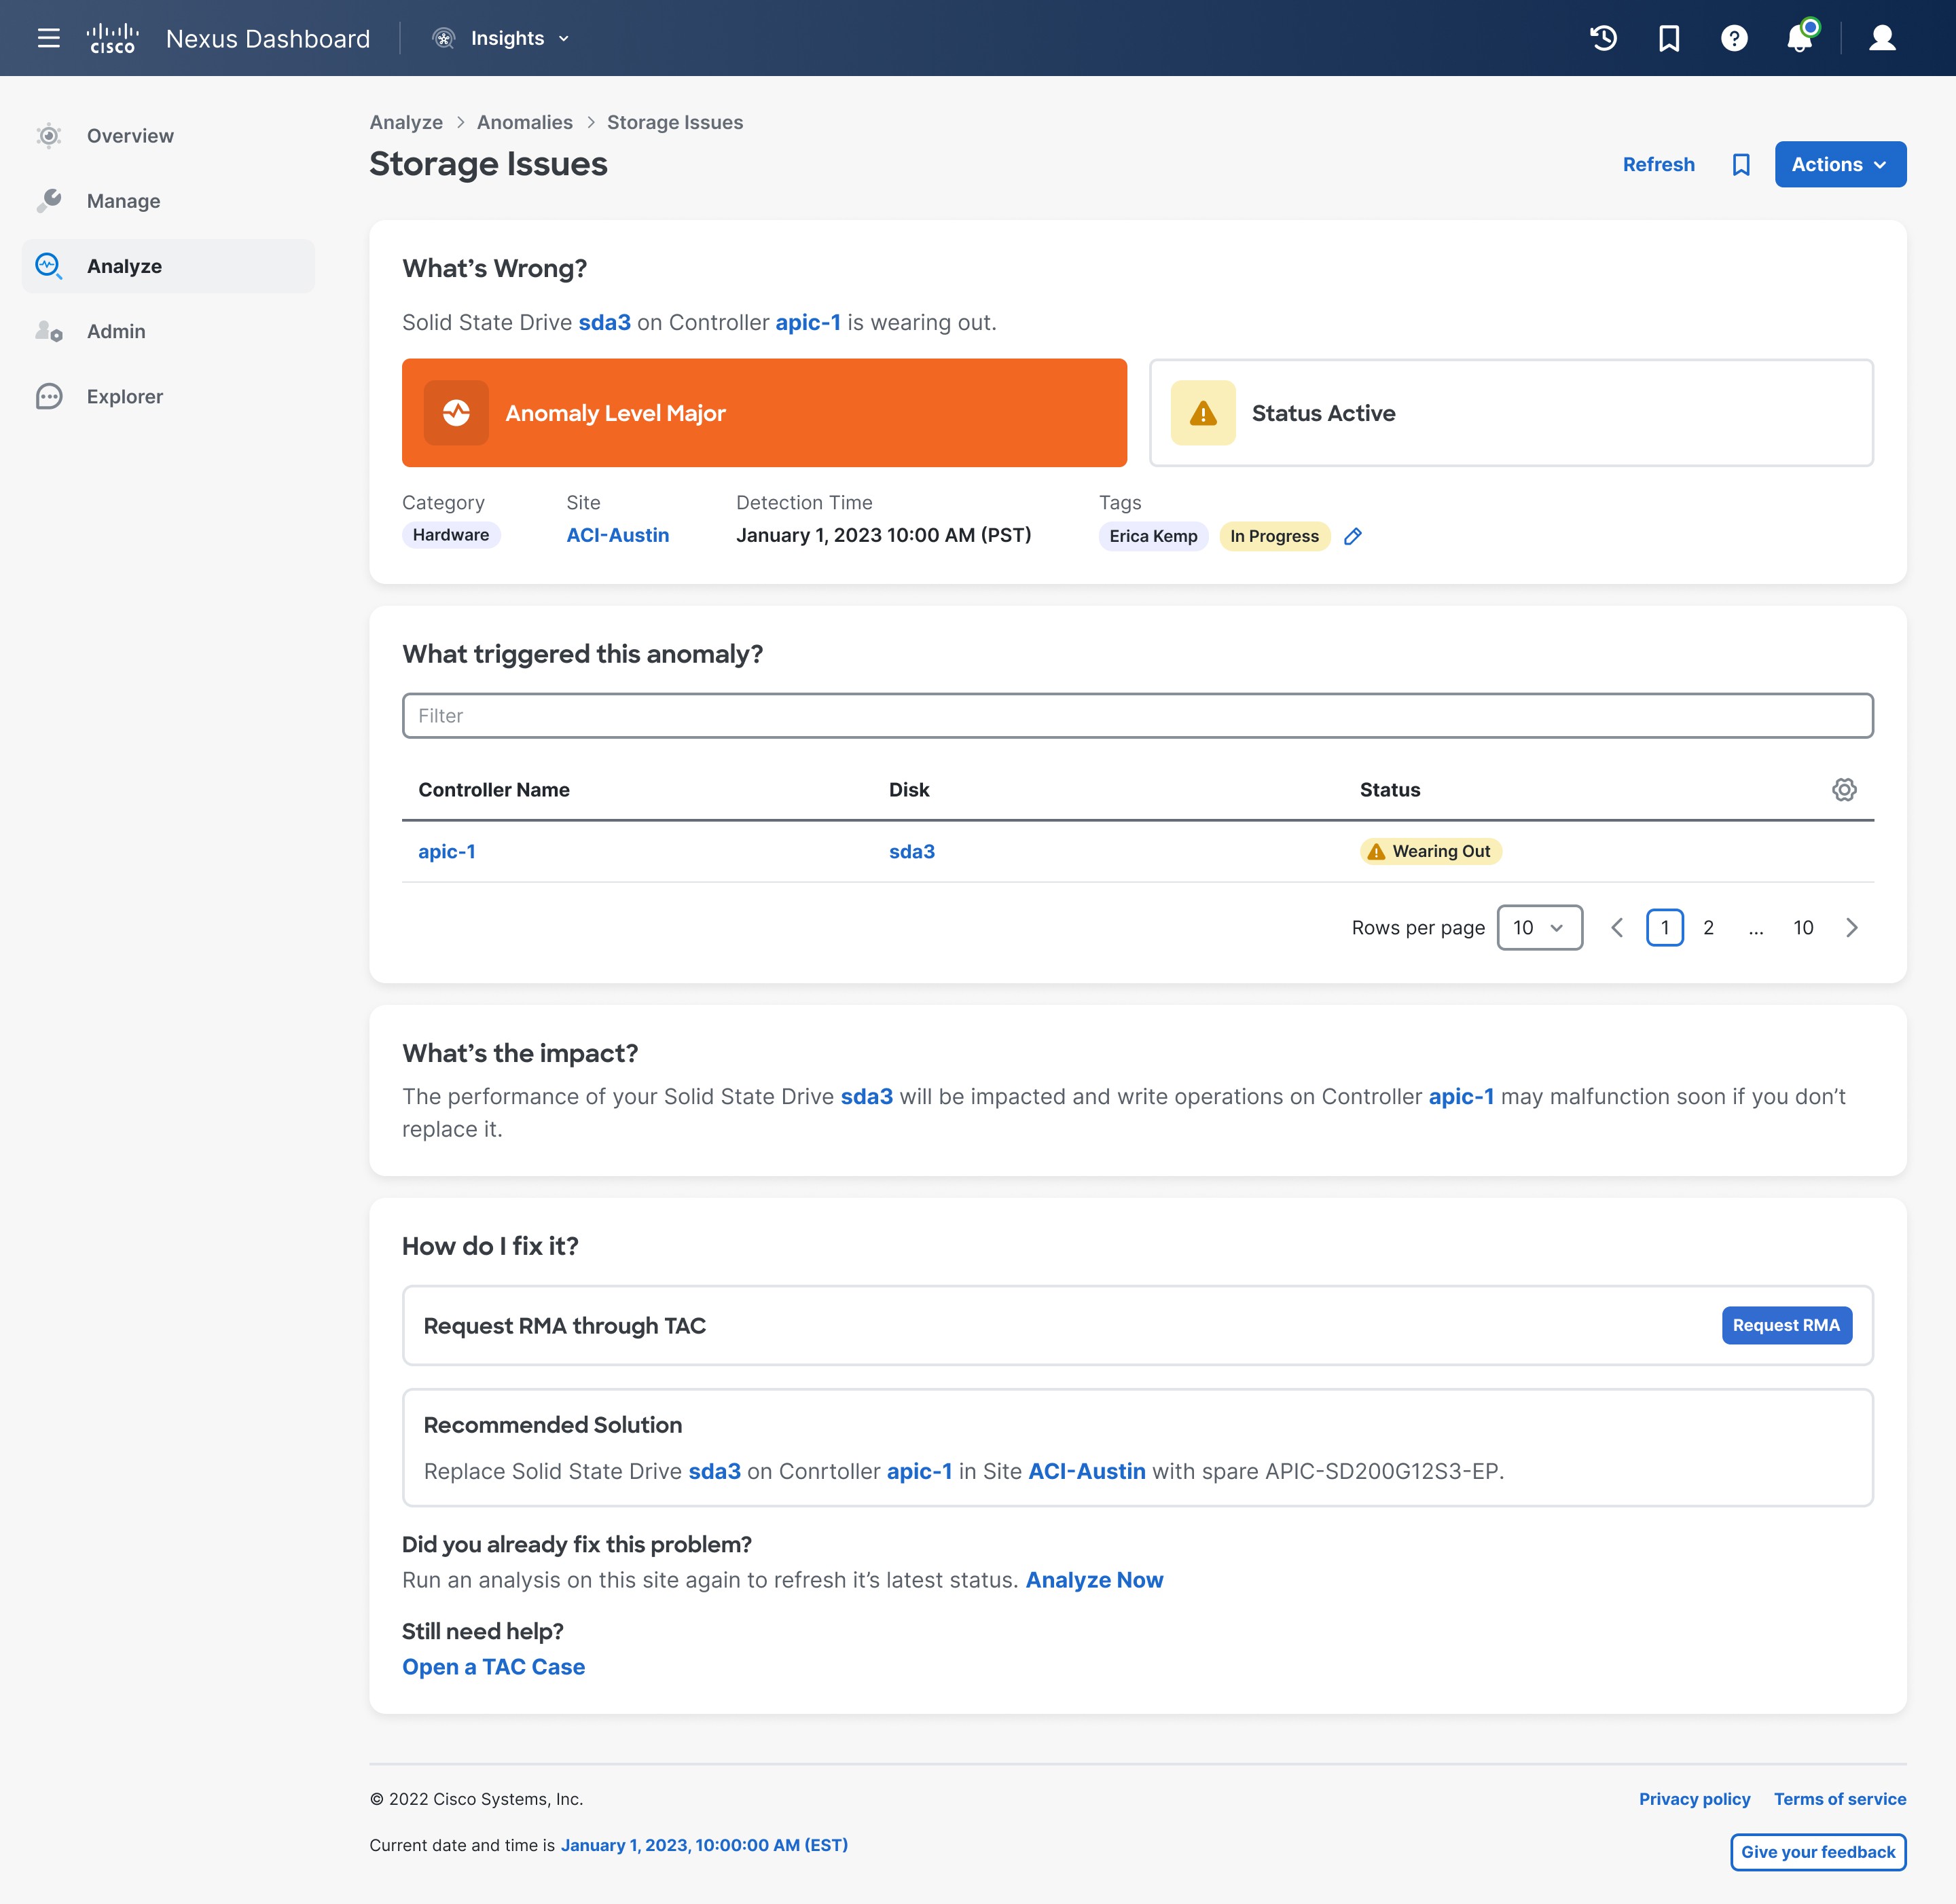
Step-by-step remediation guide
What's Wrong?
What triggered this anomaly?
What's the impact?
How do I fix it?
Customizable actions
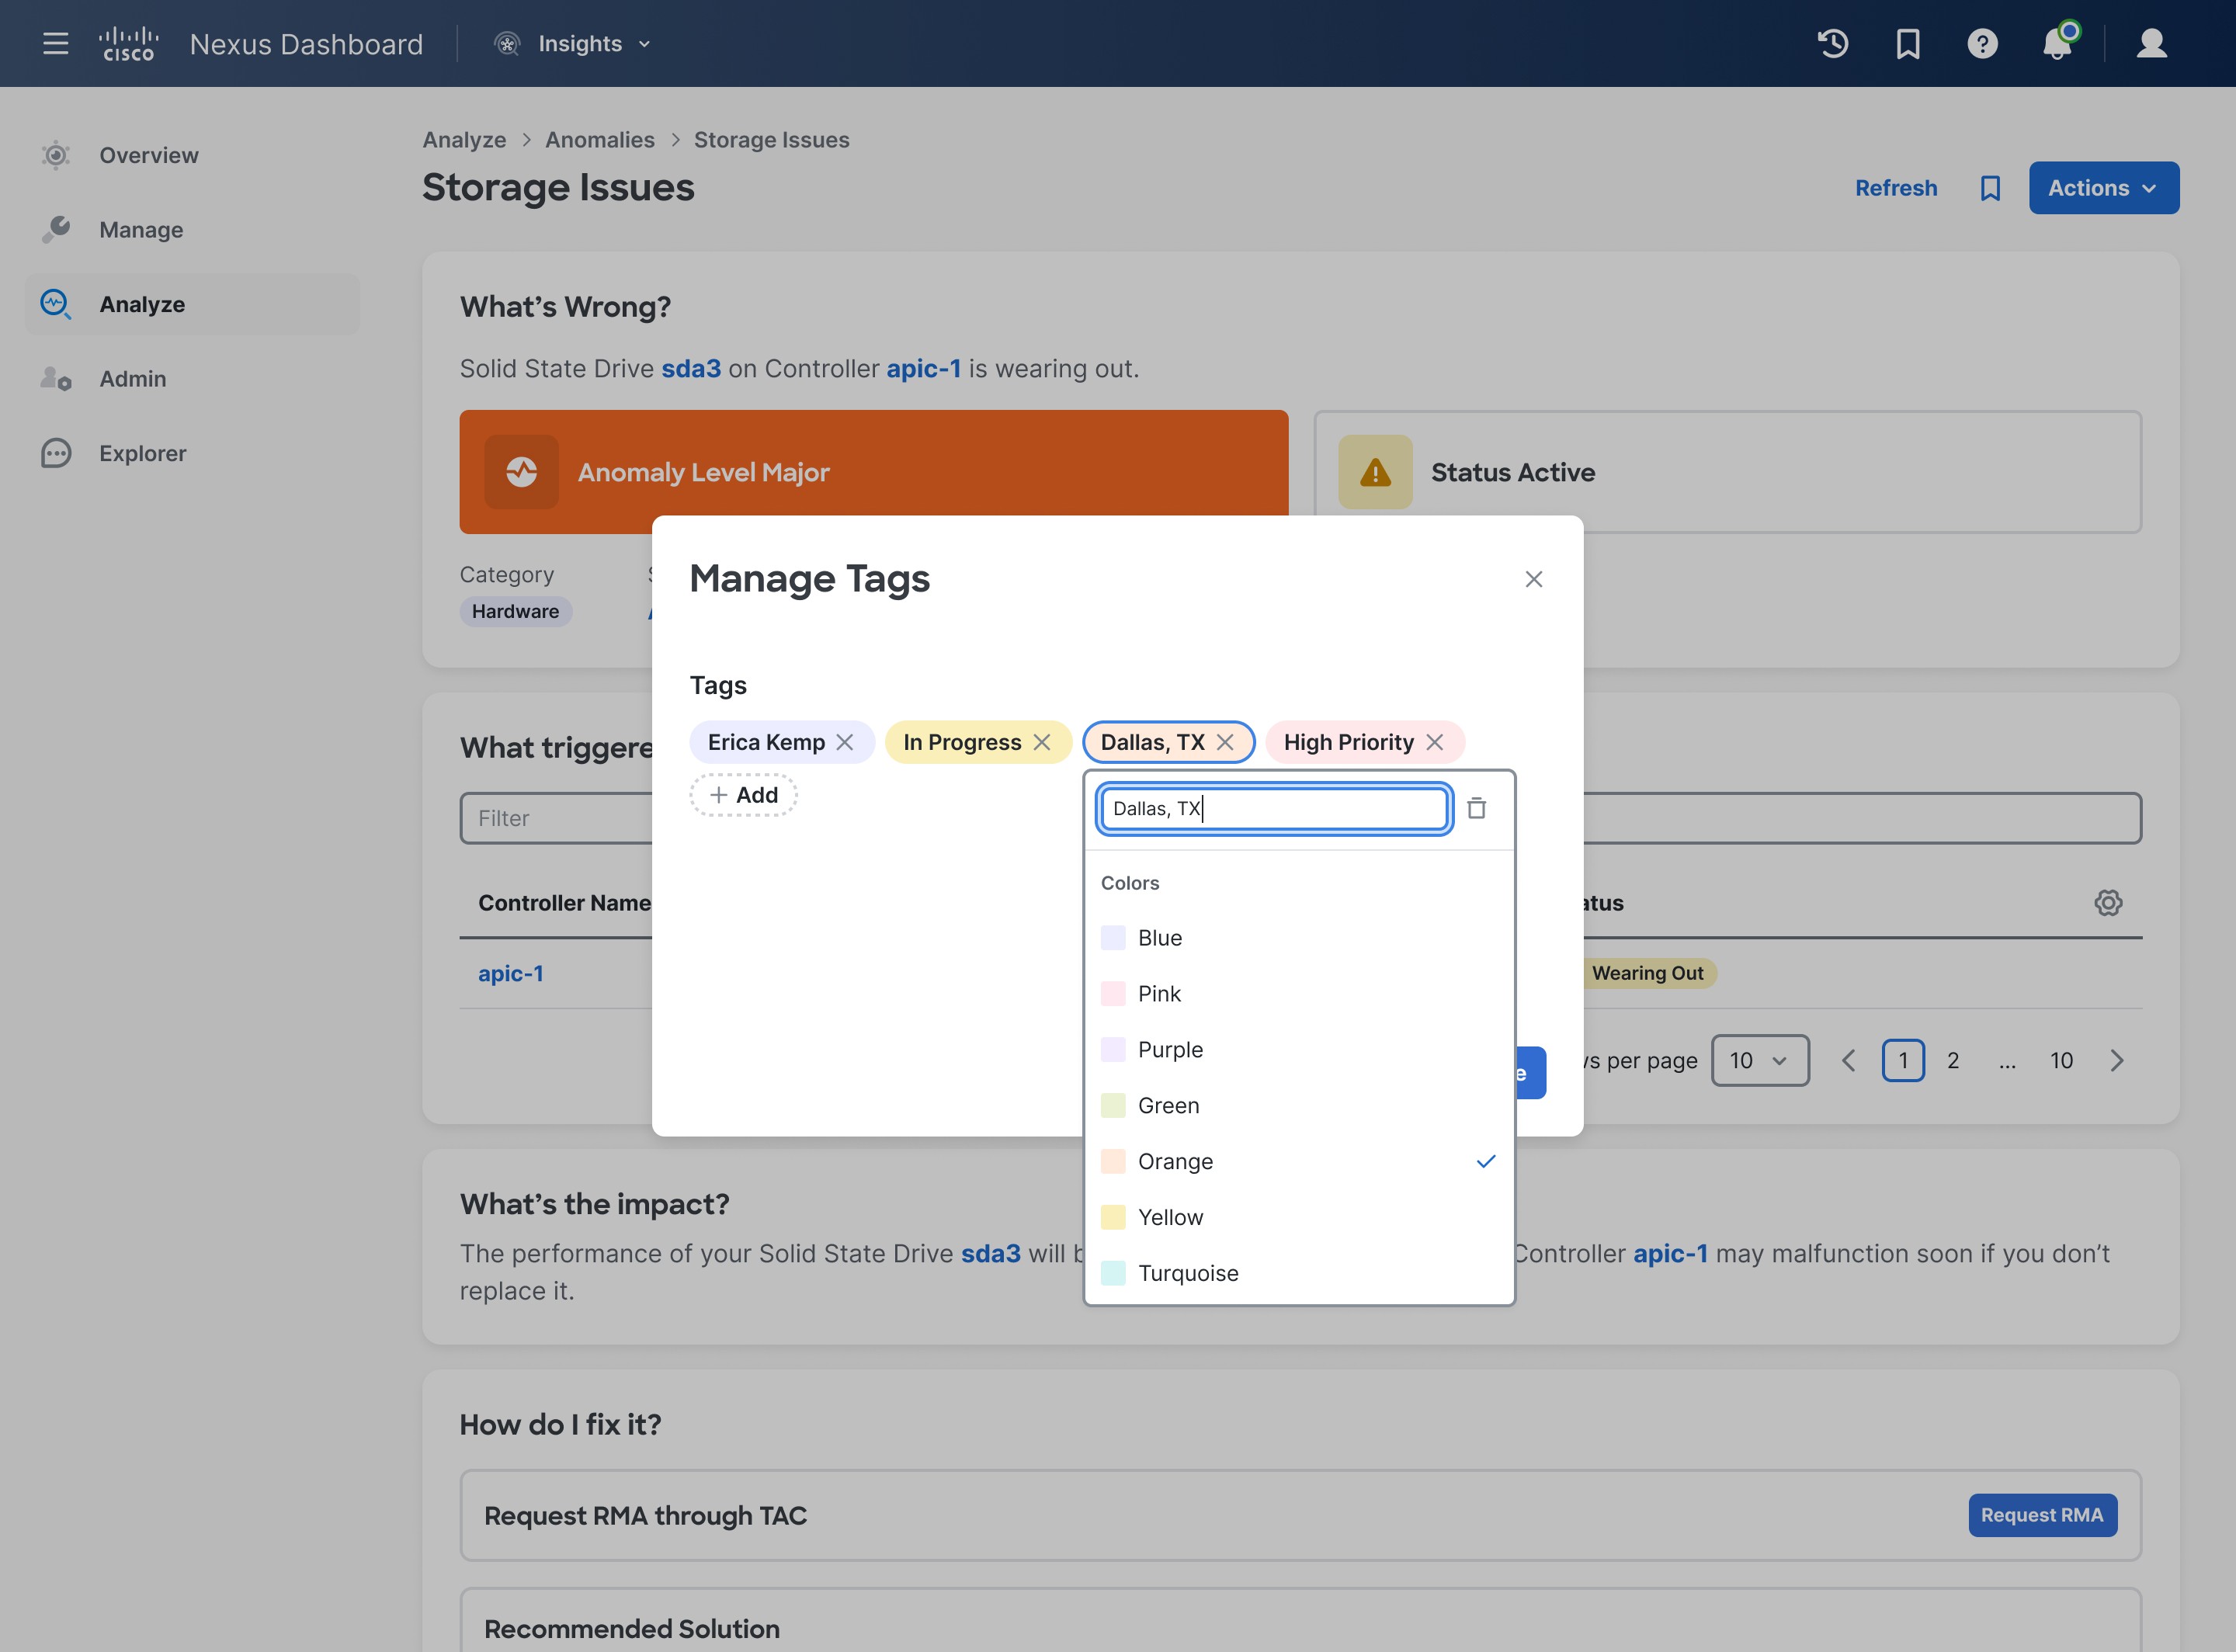
Tags

Comments
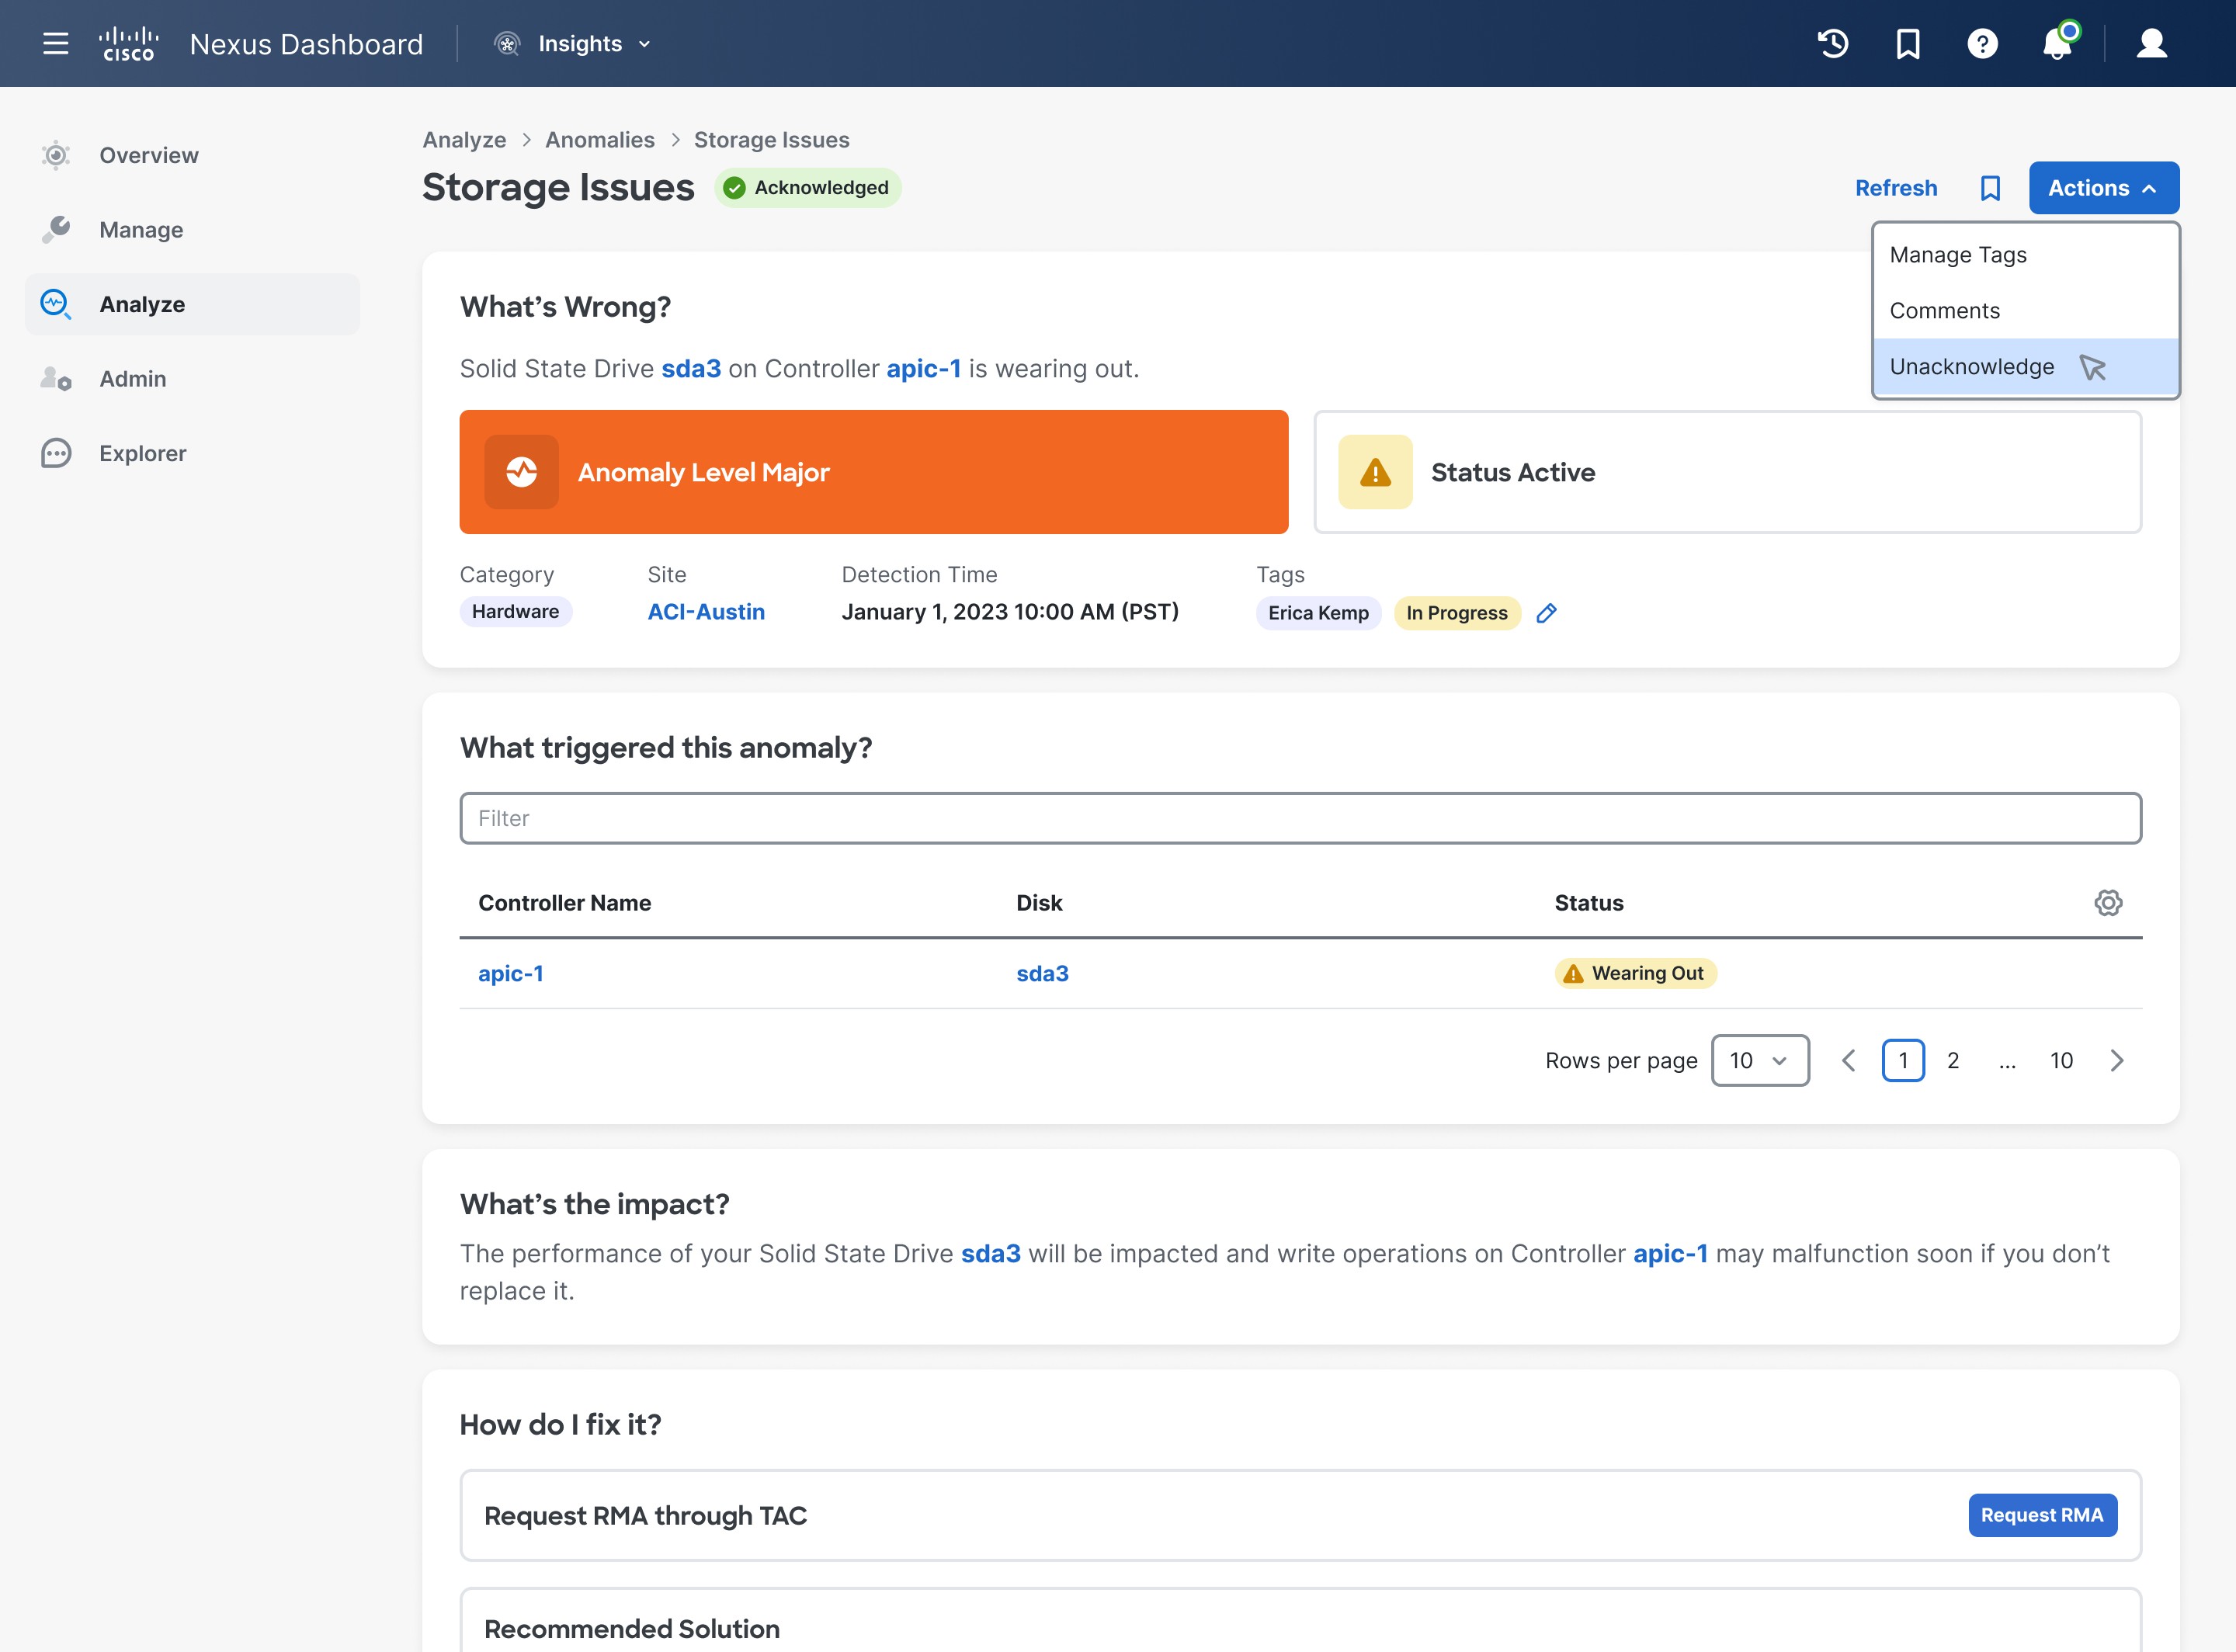
Acknowledgement

Bookmarks and recent history
Usability testing and feedback

UX Research
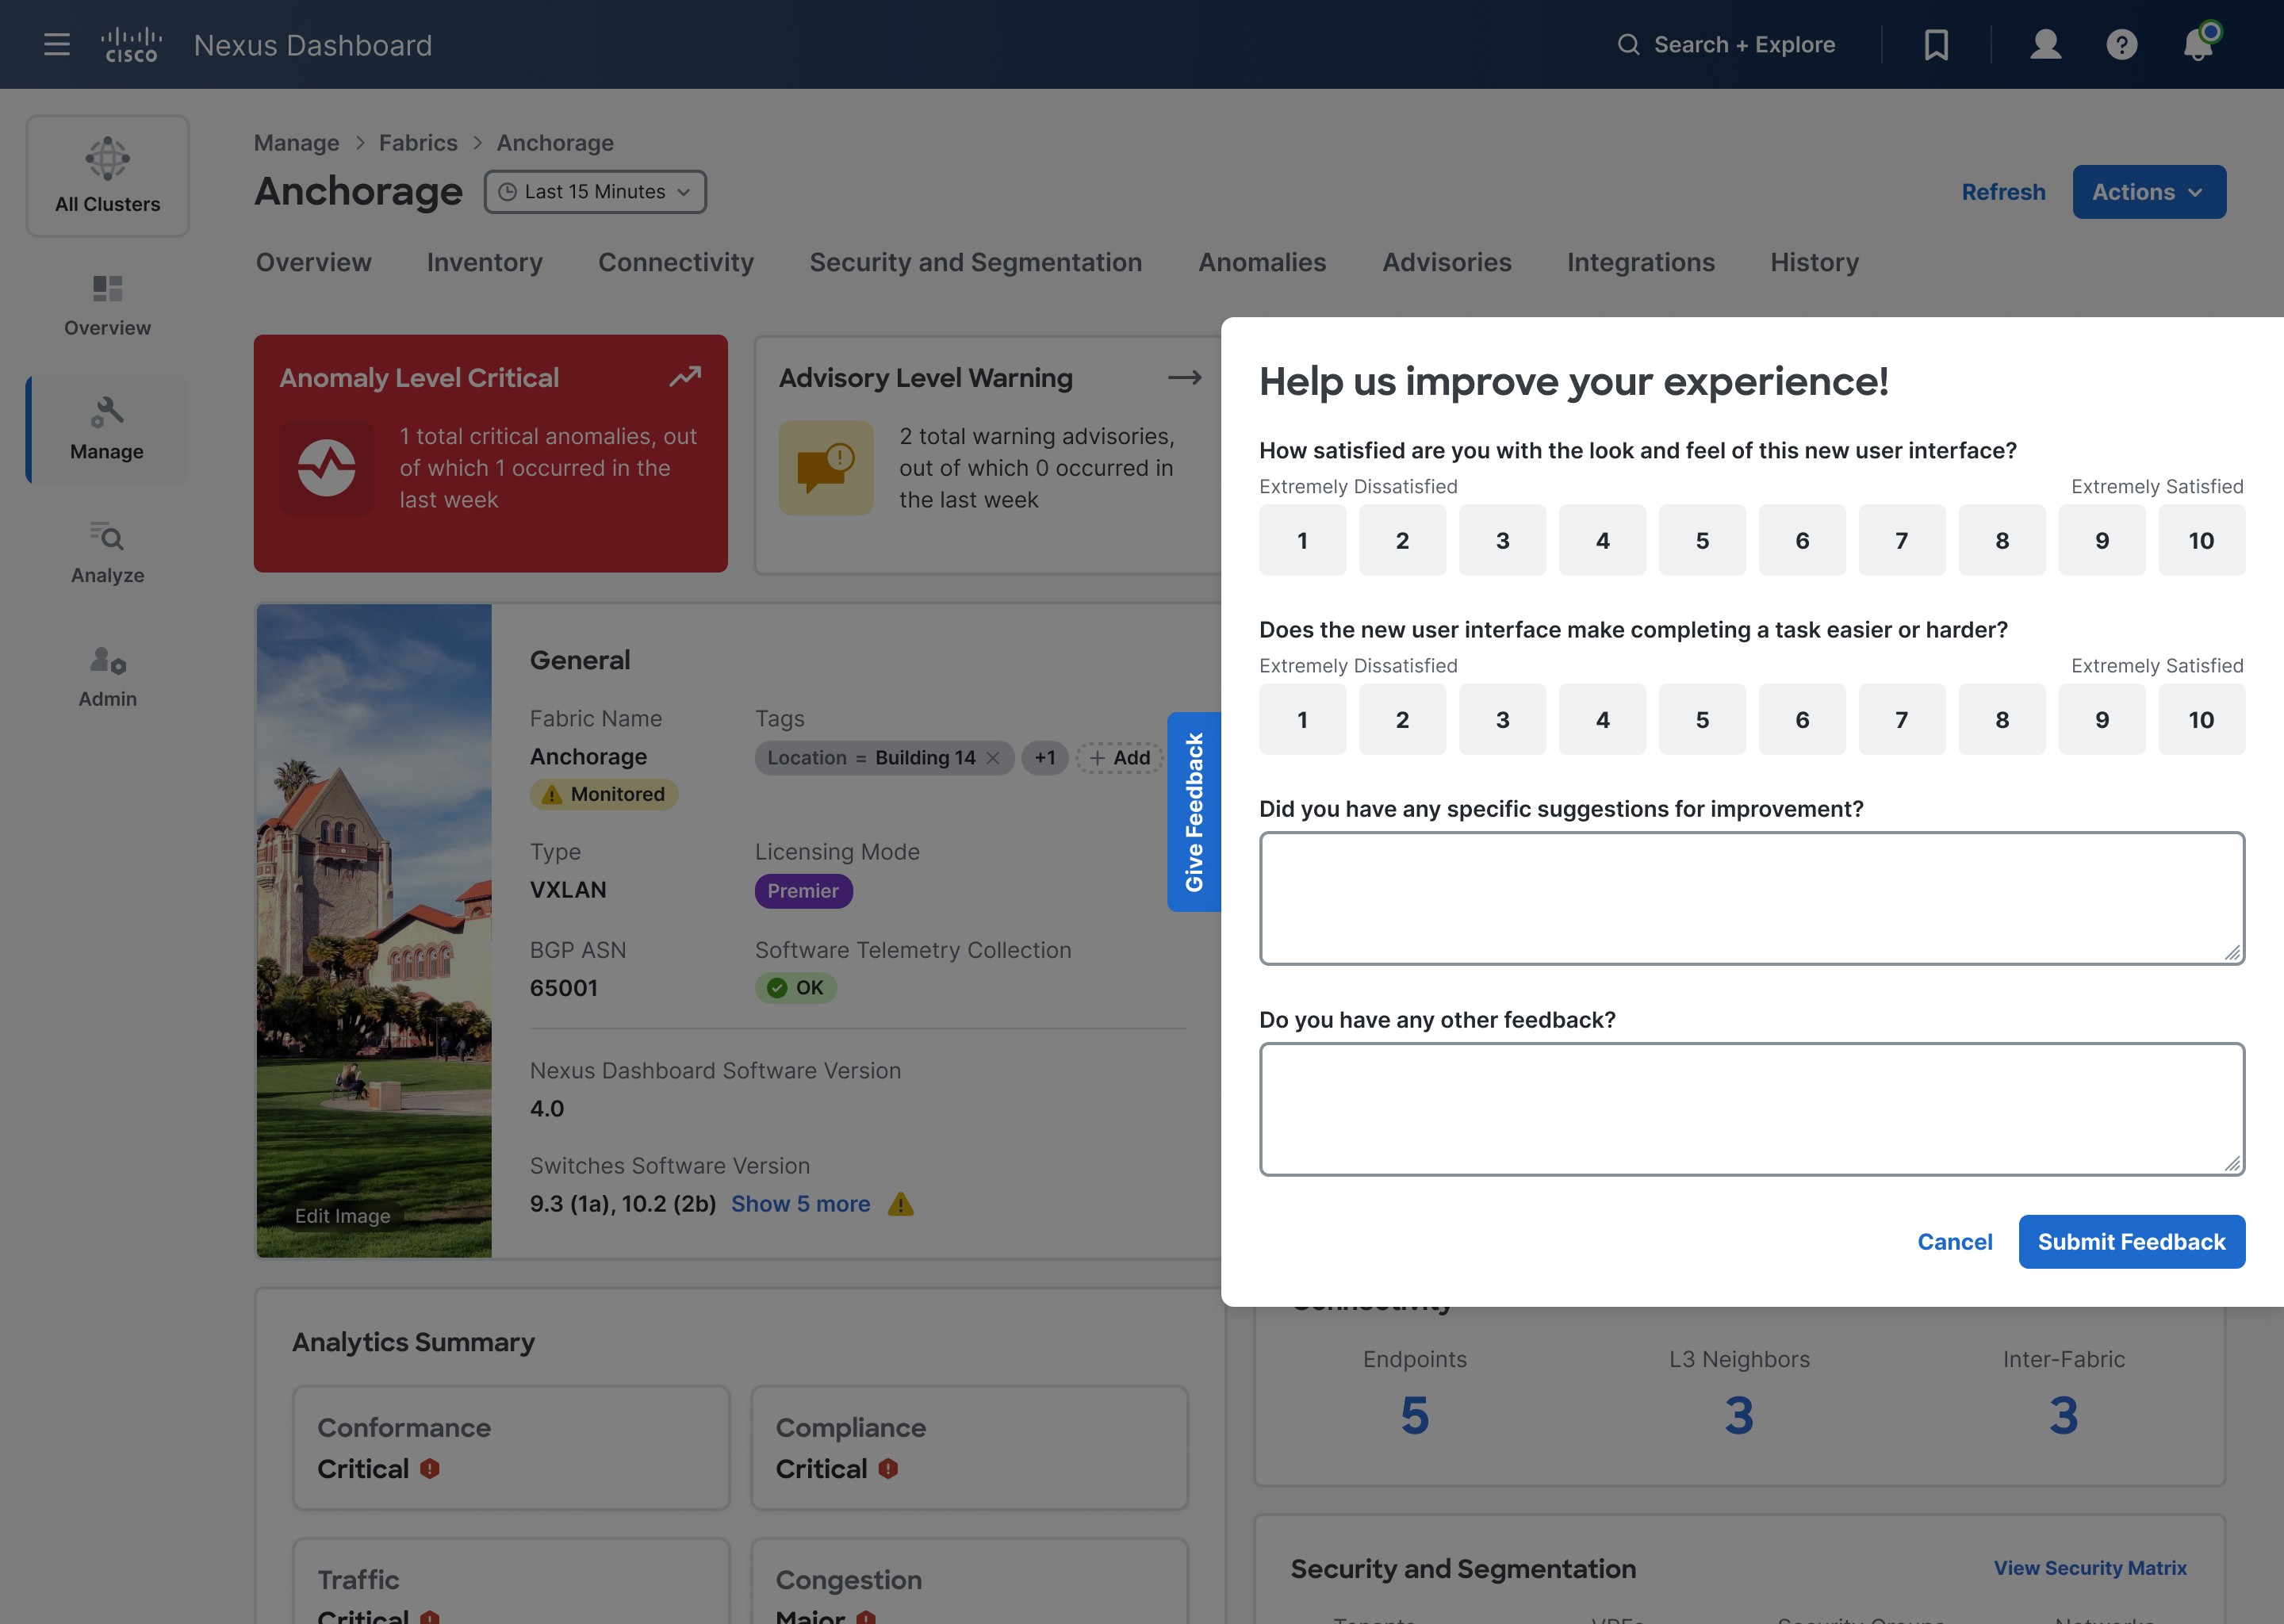
Feedback Survey
5 star reviews
Detect anomalies before they happen
Nexus Dashboard gives us a proactive notification for a specific Anomaly in each of our ACI sites. This tool provides a more efficient way to detect possible faults before they can actually happen and provides us with a recommendation on how to properly address the detected anomaly. Overall, this tool really helps us a lot in maintaining the reliability and operation uptime of our ACI Fabric.
Comprehensive network management
Cisco Nexus dashboad offers several features that make it a useful tool for network management. One of its main features is network visibility, which provides instant insights into network performance and usage patterns. This enables our tech teams to identify issues quickly and make critical decisions to resolve the issues.